Last week, I discussed how fixed income investors have begun to consider ESG investment as part of their strategies. However, the question remains: accepting the potential role of ESG in fixed income AUM growth, does integration of the dataset provide potential for outperformance? The short answer is “maybe.”
Given the size of the global credit market, however, that question gets complicated quickly. Coverage can be inconsistent. Issuers self-reporting and vendors collecting and distributing data for a region creates material gaps. Comparisons across markets are hard. Fixed income securities are beholden to term structure, market rates, and the perception of credit worthiness. Understanding the impact of these variables through an ESG lens adds to the difficulty.
The Performance Story
With that in mind, let’s take a deeper look at the potential benefit of ESG investment. To determine the potential for outperformance, I started with a global view then moved across regions using a variety of corporate benchmarks that have at least five years of history:
- Global: BofA Merrill Lynch Global Broad Market Corporate
- United States: Bloomberg Barclays US Aggregate Credit – Corporate – Investment Grade and High Yield
- Europe: Bloomberg Barclays Euro Aggregate Credit - Corporate
- Asia: JP Morgan JACI Corporates
Next, I ran annual returns from 2012 to 2016, grouping each benchmark by the MSCI Intangible Value Assessment (IVA) rating and ultimate parent using FactSet’s entity data mapping. It is important to analyze the performance story from two angles: covered vs. uncovered securities and higher-rated vs. lower-rated securities.
I summarize the regional performance in the tables below. In the first set of tables, a green highlight indicates that the IVA rating tier outperformed the uncovered tier for the period. A red highlight indicates underperformance. Similarly, in the second set of tables, a green highlight indicates that the IVA rating tier outperformed the total benchmark for the period. A red highlight indicates underperformance.
Total Return vs. Uncovered Issuers (%)
1.png?width=1072&name=Total-Return-vs.-Uncovered-Issuers-()1.png)
Total Return (Rating Tier) vs. Total Benchmark Return (%)
-vs.-Total-Benchmark-Return-()1.png?width=1087&name=Total-Return-(Rating%20Tier)-vs.-Total-Benchmark-Return-()1.png)
There are several takeaways. First, for the global, U.S., and European markets, results for the past three years seem to indicate that securities covered in an IVA rating tier outperform securities that are not covered. For Asia, the opposite is seen, as uncovered securities outperformed rated securities. Is this vendor-related or reflective of the appetite to pursue ESG objectives market by market? More research is needed to find the answer.
For the global index, coverage was high, with around 86% of market value linking to an ultimate parent with an ESG rating. The European market had a similar coverage level. Interestingly, the U.S. market saw coverage drop to about 75% of market value. Moving to Asia, we uncover the biggest coverage gap (or opportunity), where around 52% of the market value was uncovered.
Second, disparities are seen across markets in the relative performance of higher vs. lower-rated securities. The global and Asian markets indicate that lower-rated securities outperform higher-rated peers, while we see outperformance in the European market for higher-rated securities. The U.S. was mixed, with no discernable pattern.
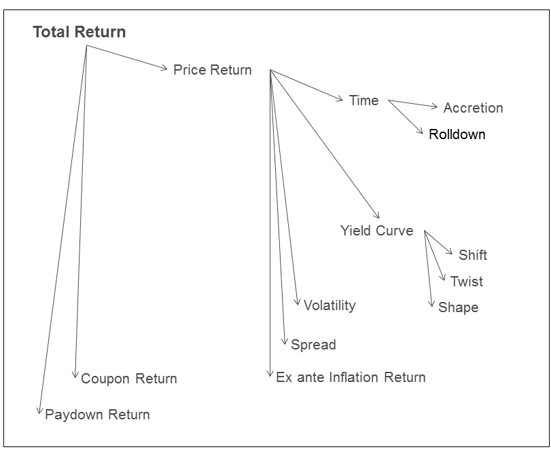
Finally, interest rates, coupons, spreads, and currency influence a fixed income security’s total return. An attribution model is required to decompose total return and determine if the ESG rating is meaningful or coincidental. I break out this detail for each market using FactSet’s Fixed Income Return Attribution model.

Bank of America Merrill Lynch Global Broad Market Corporate
The last three years appear to show that there is potential for outperformance investing in covered securities over uncovered securities when analyzing the global market benchmark. We also observe that lower-rated securities outperform higher-rated issues. Why? Unlike what we will see in the other markets, there is not one specific driver across tiers or timeframes. Duration is benign across ratings tiers, while spread appears to be a factor in some buckets, and coupon levels in others. Currency also plays a part, as the index run is from a USD perspective. With so many drivers responsible for performance, it is difficult to attribute alpha generation solely to an ESG rating.
Bloomberg Barclays US Aggregate Credit – Corporate – Investment Grade and High Yield
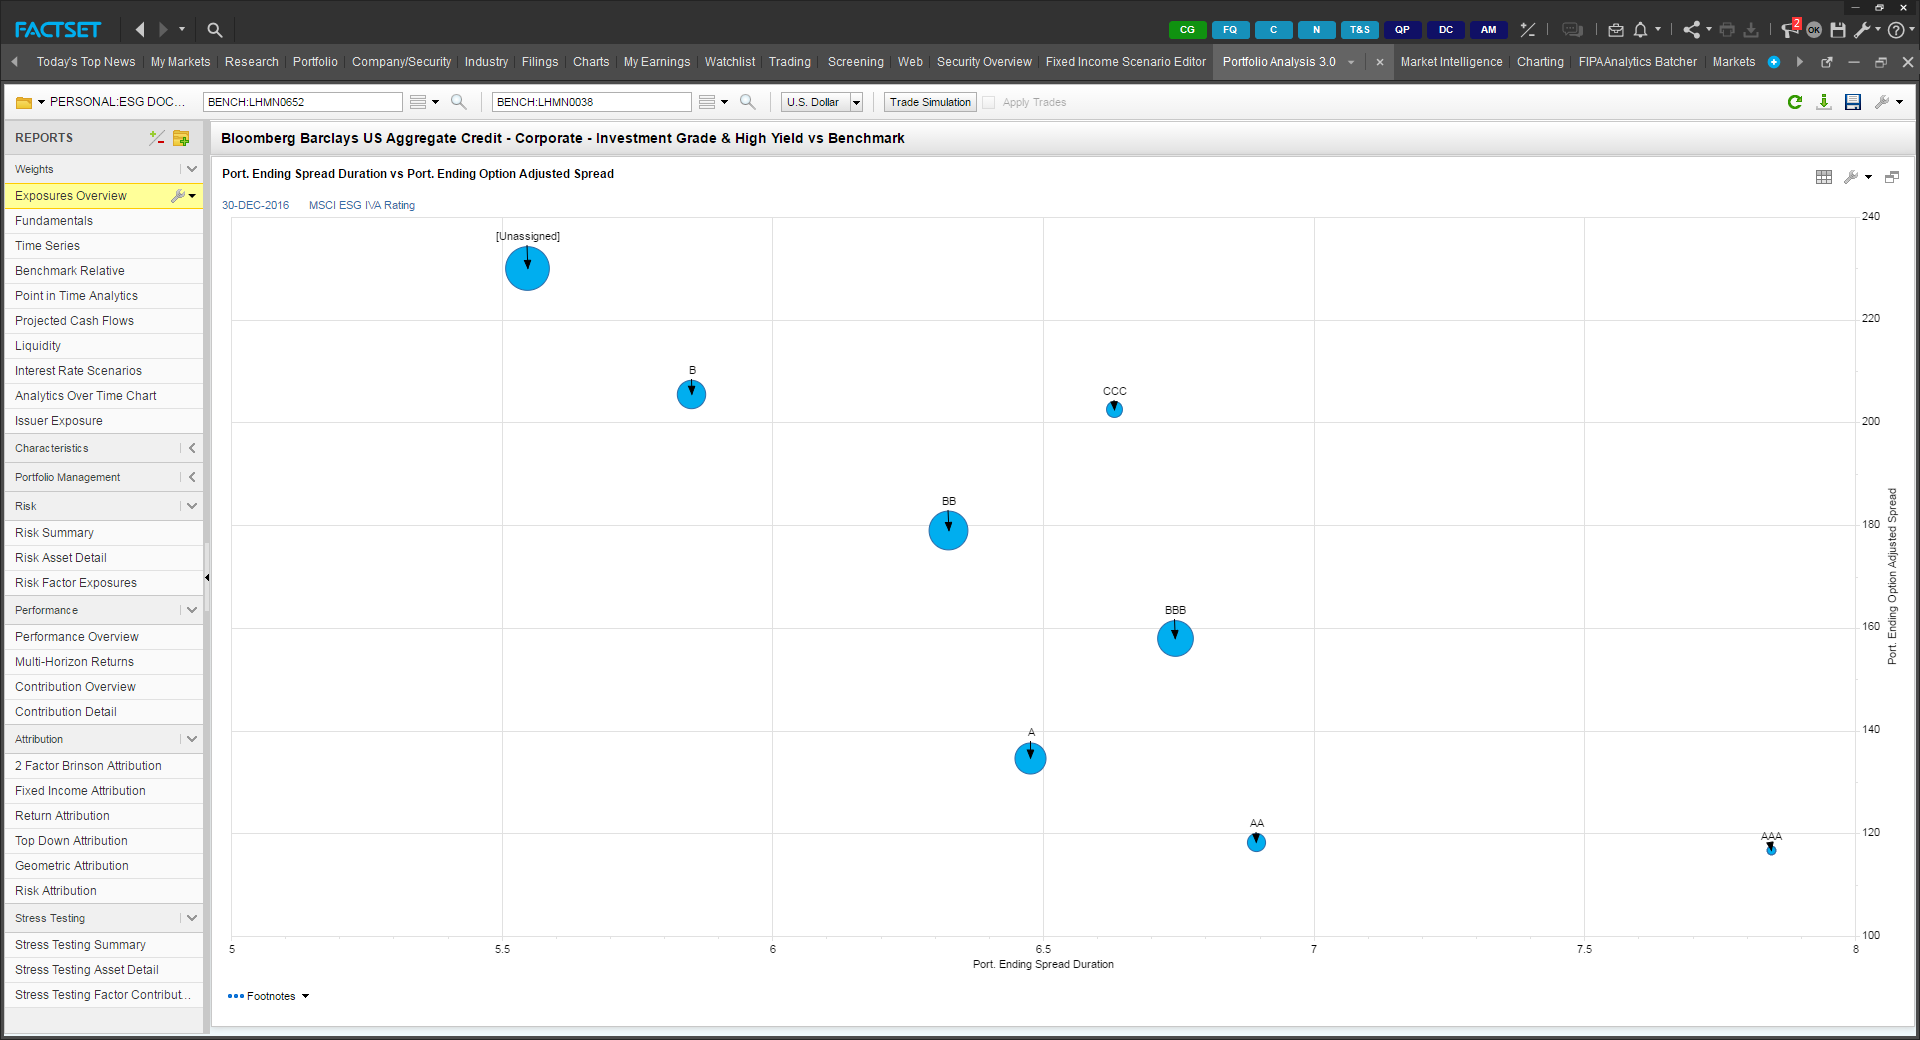
A similar pattern for covered vs. uncovered securities seen in the global universe is also present in the U.S. over the past three years. In this case, there appears to be a firmer link to the drivers of return. Note that currency is not an issue, as all securities are USD. Working backwards from 2016, duration was a negative, as the higher-rated buckets range from six months to over a year longer than lower-rated or uncovered securities and market rates increased significantly. This was offset by spread tightening and higher coupon rates seen in the higher-rated tiers, which is expected given term structure. Even though the IVA rating is not equivalent to a credit rating, it does tend to behave like one, as higher-rated tiers issue longer-dated paper, primarily because they can.

Spread was a primary driver in 2015, with less widening occurring in AAA-B relative to uncovered issues. Duration was a minor headwind. We saw the opposite in 2014, as the longer relative positioning in higher-rated names provided a boost in a generally widening spread environment.
Bloomberg Barclays Euro Aggregate Credit - Corporate
While we saw the similar three-year story in the European market that we observed in the global and U.S. universes, it is apparent that outperformance across rating tiers was spread-related in 2014-2016. Interestingly, duration across rating tiers is similar, and the low/negative rate environment points to duration acting like noise.
JP Morgan JACI Corporates
As we move further east to investigate Asia, recall that the coverage level with this data set was under 50% of market value. In this region, we see opposite results compared to what we saw in the global, U.S., and European universes. Lower-rated or uncovered securities outperform their higher-rated piers. Spread moves are generally more favorable in these uncovered assets. Duration is neutral across ratings tiers. Is this movement due to asymmetrical information or is it coincidental? This presents a potentially interesting opportunity.
Tying it All Together
In summary, as fixed income investors, we are well aware of the drivers of total return. Decomposing performance into curve, spread, carry, and currency allows us to gain more insight into the implications of our investment decisions. We have only just begun to pursue this analysis, but based on an initial review, it seems as though the trend of covered ESG rating tiers outperforming uncovered tiers is an additional component that asset owners and managers must consider in their search for alpha. Within markets, the decision to invest in higher-rated vs. lower-rated issuers is one that must be viewed from an issuer perspective.
In my next article, we will identify ex-post and ex-ante applications of ESG data in the fixed income space.
