

The British exit (Brexit) from the European Union continues to be a concern for British and European markets. Given the current uncertainty around the deadline, this topic will continue to be a focus area for these markets over the next few days and potentially weeks. Looking at company-level geographic revenue exposures, this article will analyze the price performance of FTSE 100 companies since the Brexit vote.
All data in this article is as of October 9, 2019.
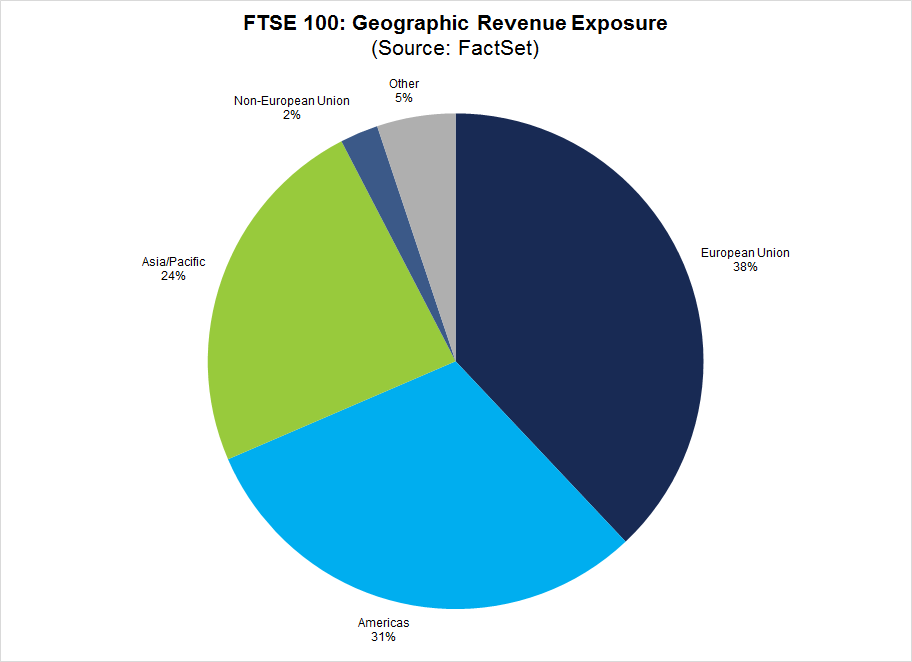
According to FactSet Geographic Revenue Exposure data (based on the most recently reported fiscal year data for each company in the index), the FTSE 100 has 38% revenue exposure to the European Union.
Given the concerns in the British and European markets about Brexit, have FTSE 100 companies with higher revenue exposure to the EU underperformed FTSE 100 companies with lower revenue exposure to the EU in terms of price performance since the Brexit vote on June 23, 2016?
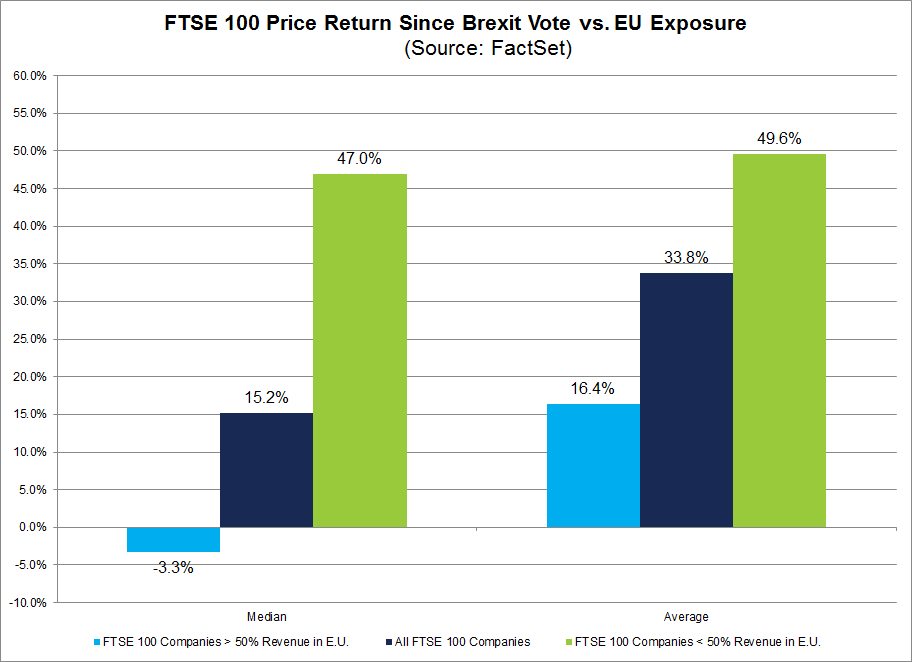
For this analysis, the index was divided into two groups: FTSE 100 companies that generate more than 50% of sales inside the EU and FTSE 100 companies that generate less than 50% of sales inside the EU. Median and average price returns were then calculated based on these two groups.
Overall, the FTSE 100 index recorded a 13.1% increase in value (to 7143.15 from 6338.1) from June 23, 2016 to October 9, 2019.
The median price return for the FTSE 100 for this time period was +15.2%. For companies that generate more than 50% of sales inside the EU, the median price return was -3.3%. For companies that generate less than 50% of sales inside the EU, the median price return was +47.0%.
The average price return for the FTSE 100 for this time period was +33.8%. For companies that generate more than 50% of sales inside the EU, the average price return was 16.4%. For companies that generate less than 50% of sales inside the EU, the average price return was +49.6%.
Thus, FTSE 100 companies with more revenue exposure to the EU have underperformed relative to FTSE 100 companies with less revenue exposure to the EU in terms of median and average stock price performance since the Brexit vote.
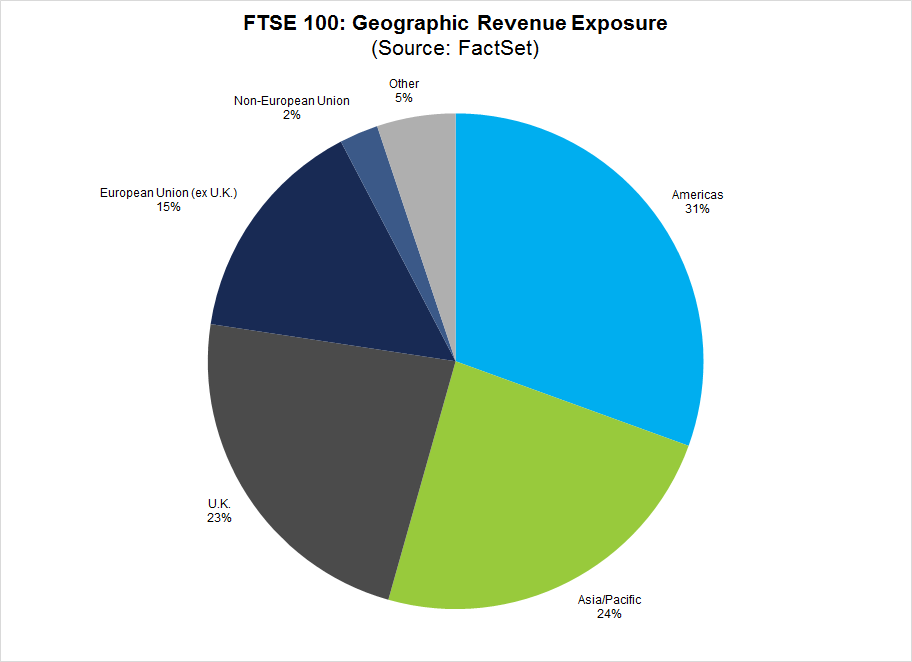
As previously noted, the FTSE 100 has 38% revenue exposure to the EU. Within the European Union, the FTSE 100 has 23% domestic revenue exposure to the U.K. and 15% revenue exposure to the rest of the European Union outside the U.K.
Is it possible the price underperformance cited in the previous section reflects market concerns with companies that have more revenue exposure to the European Union outside the U.K. rather than more domestic revenue exposure inside the U.K.? To check this possibility, the analysis was repeated looking only at domestic revenue exposure to the U.K.
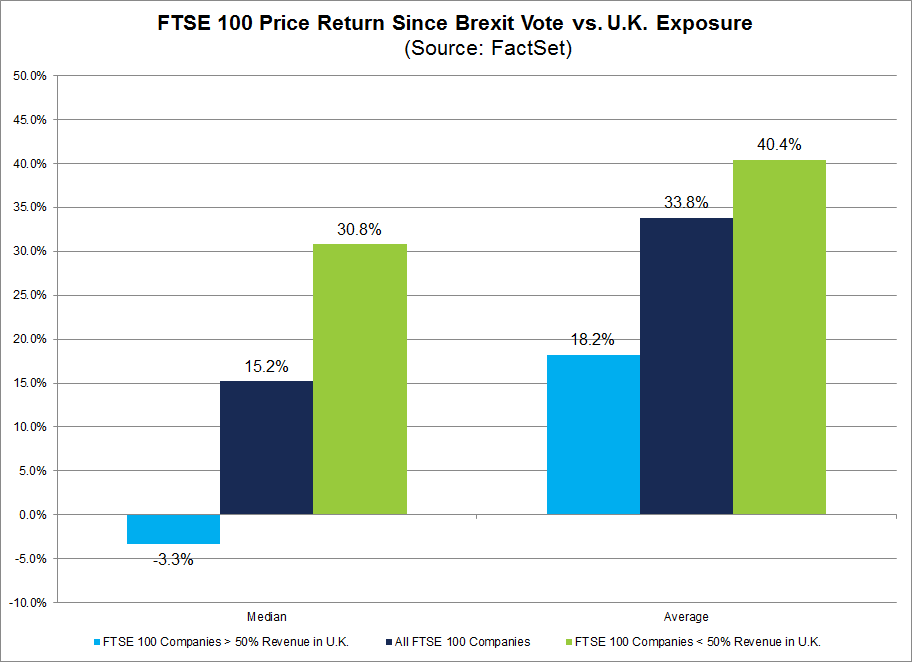
The median price return for the FTSE 100 for this time period was +15.2%. For companies that generate more than 50% of sales inside the U.K., the median price return was again -3.3%. For companies that generate less than 50% of sales inside the U.K., the median price return was +30.8%.
The average price return for the FTSE 100 for this time period was +33.8%. For companies that generate more than 50% of sales inside the U.K., the average price return was 18.2%. For companies that generate less than 50% of sales inside the EU, the average price return was +40.4%.
Thus, FTSE 100 companies with more revenue exposure to the U.K. have also underperformed relative to FTSE 100 companies with less revenue exposure to the U.K. in terms of median and average stock price performance since the Brexit vote.
Based on these results, FTSE 100 companies with high revenue exposure to the U.K. and to the European Union have underperformed relative to FTSE 100 companies with low revenue exposure to the U.K. and to the European Union in terms of median and average stock price performance since the Brexit vote. This underperformance may reflect market concerns about the potential negative impact of Brexit on companies with high revenue exposures to the U.K. and to the European Union.
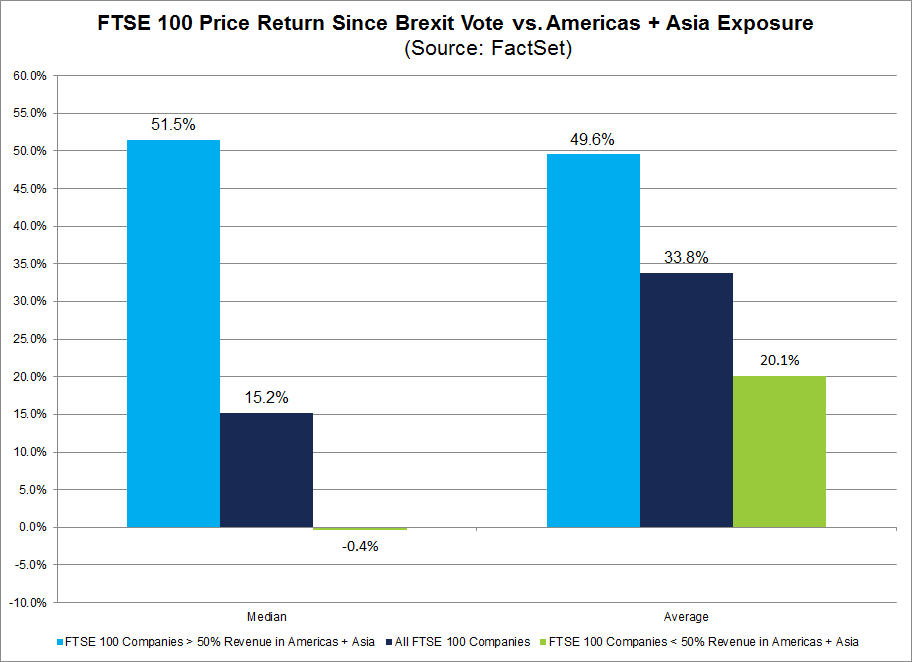
Given the price underperformance of FTSE 100 companies with high revenue exposure to the UK and to the European Union, it would be interesting to see how companies with high revenue exposure to the Americas and Asia Pacific performed over this same time frame. The analysis was repeated looking at this specific exposure.
The median price return for the FTSE 100 for this time period was +15.2%. For companies that generate more than 50% of sales inside the Americas and Asia Pacific super-regions, the median price return was +51.5%. For companies that generate less than 50% of sales inside the Americas & Asia Pacific super-regions, the median price return was -0.4%.
The average price return for the FTSE 100 for this time period was +33.8%. For companies that generate more than 50% of sales inside the Americas and Asia Pacific super-regions, the average price return was +49.6%. For companies that generate less than 50% of sales inside the Americas & Asia Pacific super-regions, the average price return was 20.1%.
Thus, FTSE 100 companies with more revenue exposure to the Americas and Asia Pacific super-regions have outperformed relative to FTSE 100 companies with less revenue exposure to the Americas and Asia Pacific super-regions in terms of median and average price performance since the Brexit vote.
FTSE 100 companies with more revenue exposure to the European Union and to the U.K. alone have underperformed relative to FTSE 100 companies with less revenue exposure to the European Union and to the U.K. alone in terms of median and average price performance since the Brexit vote. On the other hand, FTSE 100 companies with more revenue exposure to the Americas and Asia Pacific super-regions have outperformed relative to FTSE 100 companies less revenue exposure to the Americas and Asia Pacific super-regions in terms of median and average price performance since the Brexit vote.
This underperformance by FTSE 100 companies with more exposure to the EU may reflect market concerns about the potential negative impact of Brexit on companies with high revenue exposures to the U.K. and to the European Union.
It may also reflect differences in expected economic growth. In CY 2020, the U.K. is projected to see (year-over-year) real GDP growth of 1.1% and the Eurozone is projected to see real GDP growth of 1.3% according to FactSet Economic estimates. On the other hand, the U.S. is projected to see real GDP growth of 1.7% and China is expected to see real GDP growth of 5.9% in CY 2020 according to FactSet Economic estimates. It is possible the price performances are more closely connected to higher economic growth expectations in the Americas and Asia Pacific regions rather than expected Brexit impacts.


Mr. John Butters is Vice President and Senior Earnings Analyst at FactSet. His weekly research report, “Earnings Insight,” provides analysis and commentary on trends in corporate earnings data for the S&P 500 including revisions to estimates, year-over-year growth, performance relative to expectations, and valuations. He is a widely used source for the media and has appeared on CNBC, Fox Business News, and the Business News Network. In addition, he has been cited by numerous print and online publications such as The Wall Street Journal, The Financial Times, The New York Times, MarketWatch, and Yahoo! Finance. Mr. Butters has over 15 years of experience in the financial services industry. Prior to FactSet in January 2011, he worked for more than 10 years at Thomson Reuters (Thomson Financial), most recently as Director of U.S. Earnings Research (2007-2010).

S&P 500 Utilities Sector Earnings Preview: Q2 2026
Explore this FactSet S&P 500 earnings analysis for the latest trends in Utilities sector earnings growth rates and forecasts.
S&P 500 Energy Sector Earnings Preview: Q2 2026
FactSet S&P 500 earnings report: Explore Energy sector earnings growth expectations for Q2 along with sub-industry rate...
S&P 500 Financials Sector Earnings Preview: Q2 2026
FactSet S&P 500 earnings report: Explore the Q2 outlook for the Financials sector, industries, and sub-industries, including key...
S&P 500 Likely to Report Earnings Growth Above 29% for Q2
Explore current S&P 500 earnings season trends in this FactSet report. Learn the Q2 and historical quarterly performance of...
The information contained in this article is not investment advice. FactSet does not endorse or recommend any investments and assumes no liability for any consequence relating directly or indirectly to any action or inaction taken based on the information contained in this article.
