Jeremy Zhou, Senior Product Manager; Dan Grundig , Senior Product Specialist; Graham Whitelaw, CFA, Analytics Implementation Specialist; and Samantha Cheong, Product Specialist also contributed to this article.
It is well known that history doesn’t predict the future. However, a savvy investor can study certain historical patterns and be better poised to profit in the future. With the Brexit vote coming up on its one-year anniversary and an election underway that could bring similar measures to France, we will attempt to draw a parallel between Brexit and a possible Frexit and compare how investors are reacting prior to the French election by using FactSet’s GeoRev data.
The outcome of the first round of French elections on April 23 was not too surprising. independent centrist Emmanuel Macron and the far-right Marine Le Pen will go head to head in a run-off vote this Sunday, May 7. The intense emotions simmering among the French voters are reflected in the close results of the first election (23.9% versus 21.4%, respectively), causing many people, including investors, to wonder whether France will soon follow the British precedent and set on a path to leave the European Union (if Le Pen wins).
A Look Back at Brexit
While the Brexit vote caught many traders and market watchers by surprise, the market had already priced in the leave vote before the Brexit referendum. In other words, stock prices of British firms with higher domestic revenue were discounted more than those with more diversified geographic revenue. Using FactSet GeoRev, we can segregate British companies broadly into these two categories. When most investors were blindly selling all British stocks, mutual funds, or ETFs, those able to make that distinction were better prepared to identify the outperformers and hedge/avoid the underperformers far in advance of the referendum.
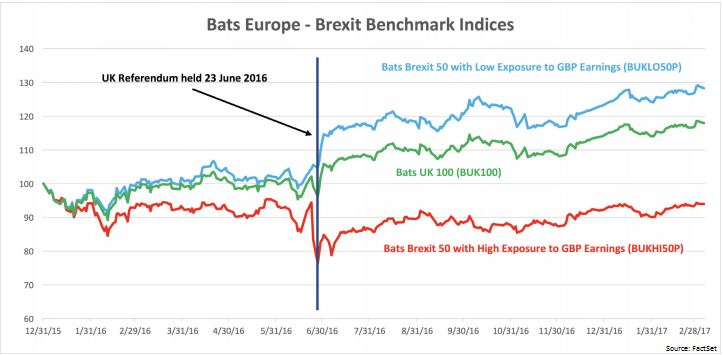
Following the instant, short-term effect of Brexit, the lingering, long-term market impacts were also an opportunity for savvy investors. For this reason, BATS launched two Brexit indices in March—the Brexit Low 50 and the Brexit High 50—featuring the 50 major UK companies with low and high exposure to the UK economy, respectively. The performance chart shows that the UK Low 50 returned more than 16% since the Brexit referendum while the High 50 stayed flat at 0.8%.

Investing in a Future with Frexit
Investors could, of course, invent their own strategies for dealing with a possible Frexit. However, a better option may be to use GeoRev to invest in French stocks. Applying a strategy similar to the one used for Brexit, we divide two French indices, CAC 40 and CAC All Share, into top and bottom groups based on their revenue exposure. The bottom group has the lower exposure to French market and is therefore more diversified to ward off the possible negative effects of Frexit, while the top group relies heavily on the domestic market, which are more vulnerable in the event of a Le Pen victory.
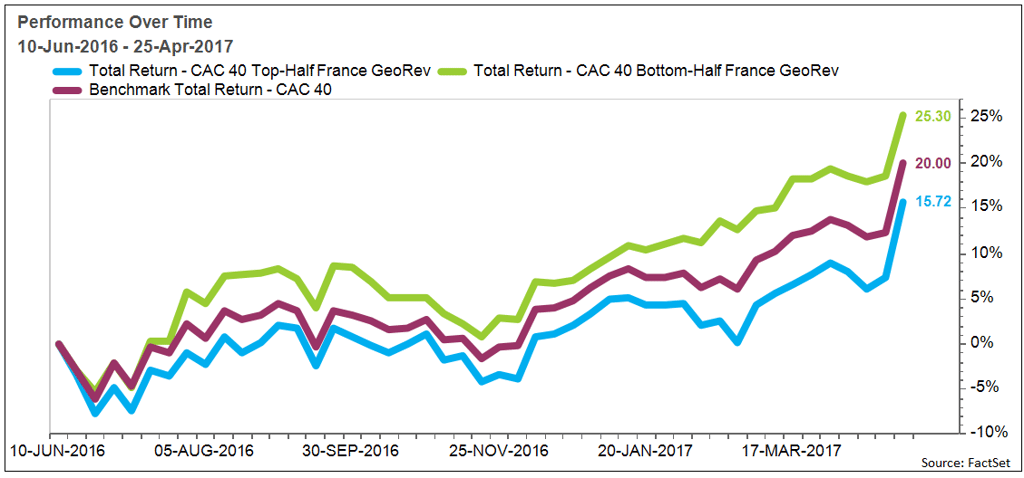
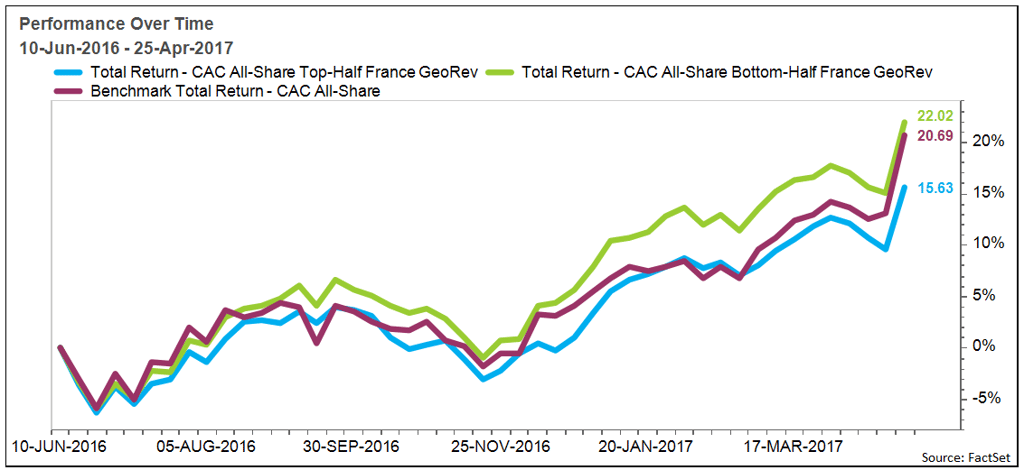
The two charts below plot the weekly cumulative total returns of CAC 40 and CAC All Shares from June 10, 2016 to April 25, 2017. Both the top and bottom groups are reconstituted on a quarterly basis, then equal weighted to compute the performance. As expected, regardless of who wins in the final round, it appears the market has already priced in the “fear” factor, differentiating the companies with high risk profiles.
You can see that in both CAC 40 and CAC All Share charts, bottom and top sides clearly diverge from the benchmarks from a year ago. In CAC 40, the bottom group yields 25.30%, while the benchmark returned 20.00%, and the top group returns a lackluster 15.72%. A larger universe (CAC All Share) shows a similar picture with returns of 22.02%, 20.69%, and 15.63% respectively.


With the higher probability that Macron will be the elected, we do not anticipate a repeat of Brexit pattern, that is, a wider divergence of the top and bottom groups in these two indices than that in the graph above. Nevertheless, investors who employ tools that help them make these distinctions are well poised to reap profits or hedge potential risk along the real-time caprices.
