

“4.0%, lowest ever rate, no closing cost!”
“2.75% Fixed Rate and skip your next payment!”
“Refinance now before it is too late!”
Offers like these flooded mailboxes and airwaves over the past few years with promises of historically low mortgage rates. But these rates, of course, are reserved for the best borrowers with a high FICO score who intend to purchase property with at least 20% down. Any variation in those two factors results in additive adjustments to the quoted mortgage rate. There are other adjustments for the type of property, the state, loan size, and income documentation status, but the main factors are loan-to-value (LTV) and FICO.
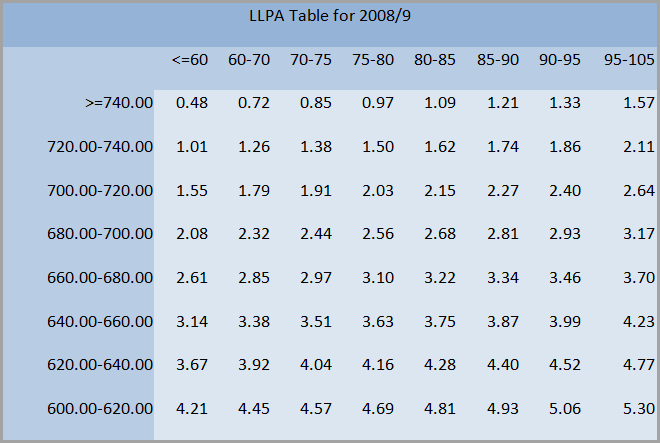
The image below is a typical rate sheet table that mortgage brokers use to quote a mortgage rate, called the Loan Level Pricing Adjustments (LLPA) table. A model that can predict LLPA values is valuable for mortgage prepayment prediction, as it goes into the calculation of the refinancing incentive. But how has the LLPA table has changed recently, especially during the credit crisis?
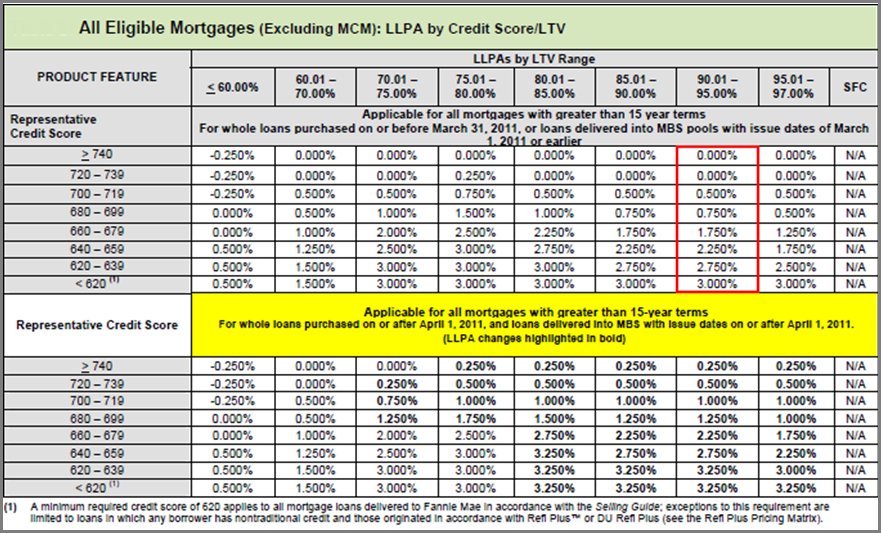
Source: Fannie Mae
We can see that the lower the credit score or the higher the LTV, the more LLPA points will get added to the basic mortgage rate. Based on this pattern, let’s explore a linear function to model the LLPA with respect to the FICO score and LTV. Though we do research other functional forms to capture dynamics beyond LTV and FICO, a simple stylized function will be sufficient to illustrate the interaction between economic events and the LLPA table:
LLPA = Coef_LTV *( LTV-80) + Coef_FICO*(740-FICO)+constant
Due to the positive correlation between LLPA and LTV, we expect a positive parameter for the LTV factor in our model. The opposite holds true for credit score. The quantity of the parameters determines the influence these factors have on the LLPA points. We also adjusted the formula so that the effect of the two factors is easier to compare.
To understand how these coefficients or parameters change through time, we ran the individual agency pool mortgage rates from June 2007 to December 2010. The results are shown here:
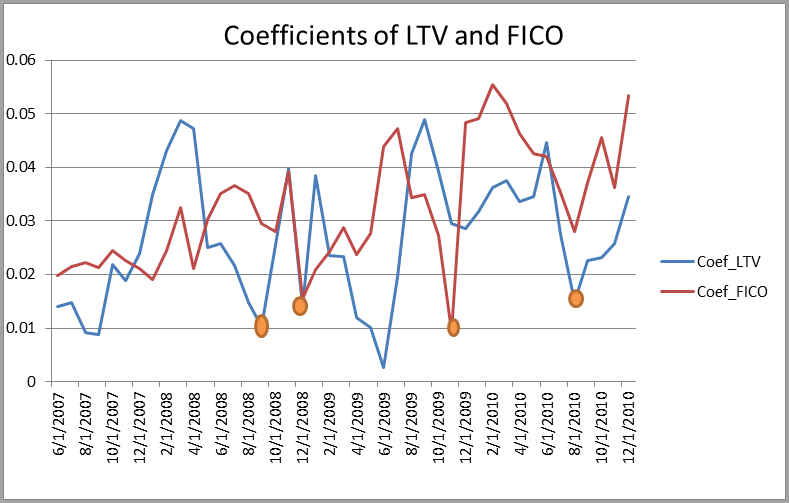
We found an interesting pattern where the FICO or LTV coefficients bottomed out at major turning points in the economy. In our testing period, we found four big drawdowns:
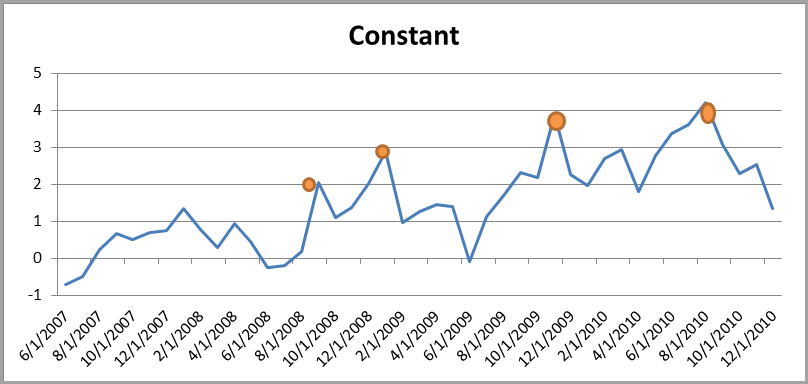
It is no surprise that interest rate spreads are sensitive to the economy. What is insightful here is the decomposition of the spread into a level, a FICO parameter, and an LTV parameter.
Studying the patterns of these components, we can see that overall adjustment is still much higher than pre-crisis levels, although it started to decline as the housing market began to bottom out. The peak of the constant shows that bankers raised the threshold for all borrowers, which indicates they are less willing to lend money. This contrasts with the negative value of the average LLPA constant pre-2007, when housing was considered the ultimate asset.
It is also instructive to see the change in importance between FICO and LTV to the LLPA levels. As home prices increased during the early part of 2007 (when the extent of the coming decline was not yet factored in), LTV played a larger role in the LLPA adjustment. However, as housing price volatility picked up during the crisis, so did the LTV coefficient. FICO’s coefficient seems to vary as well, and its importance has increased over the study period, which may indicate that more stringent criteria is being applied to the origination process.
The contribution of bad credit and high LTV is not as significant when the market is stable for bankers applying the risk adjustment. The following two tables are the LLPA tables we generated for August 2007 when market was stable and September 2008 when the market collapsed.
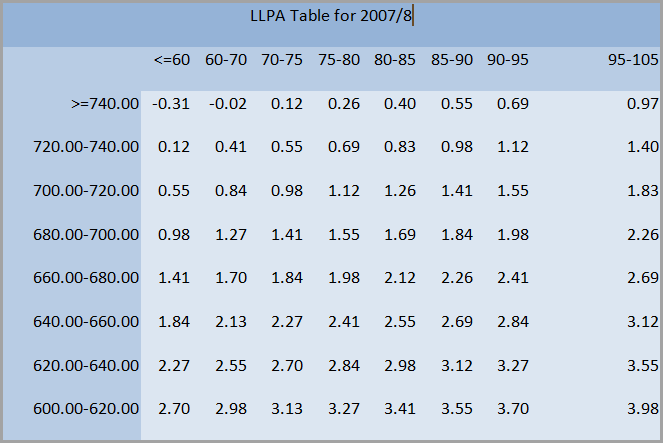
So while the LLPA is much larger in 2009 than in 2007, this observation by itself is not complete. It is crucial to notice the higher penalty on bad credit compared with high LTV, which provides insight into the mortgage market. It has become increasingly important over recent years with the housing crisis and government-sponsored mortgage programs to value each component: refinance, default, pre-2007 equity-cash-out, and post-2007 refinance lockout.

Consumer Price Index (CPI) for June 2026 is Projected to Rise 3.8% Year-Over-Year
Explore FactSet's June 2025 CPI forecast, estimating a 3.8% rise. Get insights into inflation trends and economic impact for...
Total Nonfarm Payrolls for June 2026 Are Projected to Rise By 100,000
Stay updated with our monthly series analyzing nonfarm payroll data and job trends. Get expert insights and projections to...
Consumer Price Index (CPI) for May 2026 is Projected to Rise 4.2% Year-Over-Year
Explore FactSet's May 2026 CPI forecast, estimating a 4.2% increase. Get insights into inflation trends and economic impact for...
Total Nonfarm Payrolls for May 2026 Are Projected to Rise By 105,000
Stay updated with our monthly series analyzing nonfarm payroll data and job trends. Get expert insights and projections to...
The information contained in this article is not investment advice. FactSet does not endorse or recommend any investments and assumes no liability for any consequence relating directly or indirectly to any action or inaction taken based on the information contained in this article.

Insight/Author%20Bios/BadgeNLWF.svg)