Jennifer Kelly, Analytics Consultant, contributed to this report.
As its “fearless girl” statue stares down the bull of Wall Street, State Street Global Advisors also marked this week’s International Women’s Day by issuing a statement that mandates an increase in female representation on corporate boards. The asset manager is looking to create a sense of urgency with regard to gender diversity by pledging to vote against companies that lack female directors and cannot prove a shortage of qualified female nominees. Companies within the Russell 3000, FTSE 350, and S&P/ASX 300 have approximately one year to progress before State Street Global Advisors plans to enforce its new policy.
How Diverse Are Corporate Boards?
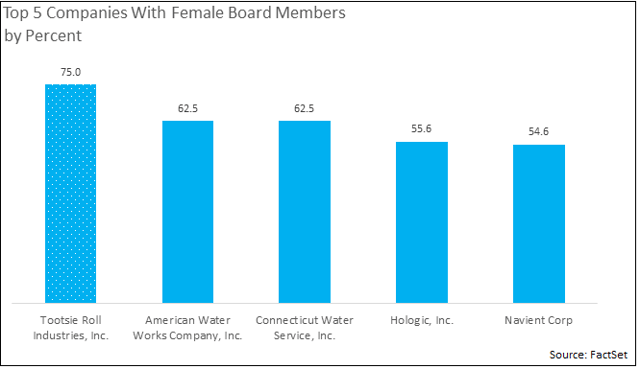
Today, 23% of companies within the Russell 3000 have zero female board members and 58% have boards composed of less than 15% female members. On the other side, five companies have female-majority boards: Tootsie Roll, American Water Works Company, Connecticut Water Service, Hologic, and Navient.

Data suggest that increasing female board members will result in shareholder benefits. Publicly traded companies with gender diverse boards (where at least 40% of the board members are women) demonstrate higher return on equity and return on invested capital and lower price volatility than their peers, especially companies with exclusively male boards.
|
|
Return on Equity
|
Return on Invested Capital
|
Price Volatility (3-Yr)
|
Price Volatility (5-Yr)
|
|
Russell 3000 Constituents
|
10.2%
|
10.6%
|
6.7
|
6.8
|
|
Companies without female board members
|
-9.3%
|
-1.1%
|
10.5
|
10.4
|
|
Companies with gender diverse boards
|
22.3%
|
11.0%
|
6.1
|
5.9
|
**All values in the table above are calculated using the weighted average.
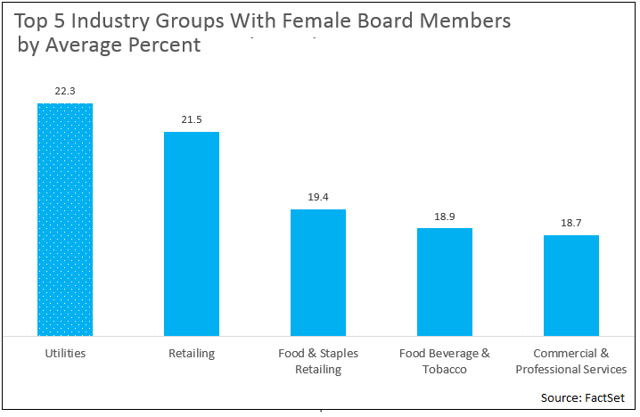
The industry groups with the highest female representation are Utilities, Retailing, Food and Staples Retailing, Food Beverage and Tobacco, and Commercial and Professional Services. However, even within the leader in this category, Utilities, women hold less than a quarter of board seats.

How Do Male and Female CEOs Compare?
Looking at the CEOs of the Russell 3000, we learn that the median age for male and female CEOs was comparable at 57 and 56, respectively. Additionally, the gender wage gap closes significantly by the CEO level, with the average and median compensation for female CEOs being approximately 95% of the average and median compensation for male CEOs. This age and compensation comparison suggests that male and female CEOs are equivalently experienced and successful in this role; however, less than 5% of Russell 3000 firms have female CEOs. All told, there are 120 CEOs named David and 120 CEOs named John, and only 143 female CEOs total within the Russell 3000.
|
|
Average/Median Age
|
Average Compensation
|
Median Compensation
|
Percentage
|
|
Male CEOs
|
57
|
$5,575,597
|
$3,702,120
|
95.111%
|
|
Female CEOs
|
56
|
$5,349,088
|
$3,514,722
|
4.889%
|
Traditionally, Non-GAAP has been an important illustration of the effects of day-to-day operations on a company’s bottom line. For this reason, Non-GAAP earnings have been preferred historically over the regulator’s GAAP. Non-GAAP is calculated by adjusting for the one-offs, non-recurring, non-core, or extraordinary items. The values associated with these adjustments are added back in the calculation to Non-GAAP earnings. As companies face increasing pressure to perform well in a challenging economic climate, the amount of adjustments that are added back has come into question. The SEC has increased its watch on companies that place undue prominence on Non-GAAP measures. Many are under the impression that Non-GAAP earnings are becoming less relevant as investors question the validity of certain adjustments.
With regard to the Russell 3000, companies under female leadership display a lower range of differences between Non-GAAP and GAAP numbers last year. For companies with female CEOs that did adjust earnings, the maximum gulf between Non-GAAP and GAAP measures was $9.26 last year. Companies with male CEOs had a much higher maximum gulf, with the high end of the range at $36.07.
Male CEO – Top 10 Gulf Between Non-GAAP and GAAP
|
Ticker
|
Company
|
Percent Female Board
|
CEO Gender
|
2016 EPS Non-GAAP
|
2016 EPS GAAP
|
2016
Gulf
|
|
PRGO
|
Perrigo Co. Plc
|
20.0
|
Male
|
7.11
|
-28.96
|
36.07
|
|
SSYS
|
Stratasys Ltd.
|
11.1
|
Male
|
0.19
|
-26.64
|
26.83
|
|
TGI
|
Triumph Group, Inc.
|
10.0
|
Male
|
5.34
|
-21.21
|
26.55
|
|
TLRD
|
Tailored Brands, Inc.
|
22.2
|
Male
|
1.80
|
-21.26
|
23.06
|
|
PCLN
|
Priceline Group Inc
|
20.0
|
Male
|
65.63
|
42.65
|
22.98
|
|
ENDP
|
Endo International Plc
|
18.2
|
Male
|
4.73
|
-14.48
|
19.21
|
|
FE
|
FirstEnergy Corp.
|
12.5
|
Male
|
2.63
|
-14.49
|
17.12
|
|
AVGO
|
Broadcom Limited
|
11.1
|
Male
|
11.45
|
-4.86
|
16.31
|
|
CYH
|
Community Health Systems, Inc.
|
11.1
|
Male
|
0.46
|
-15.54
|
16.00
|
|
AGN
|
Allergan plc
|
15.4
|
Male
|
13.51
|
-2.45
|
15.96
|
Female CEO – Top 10 Gulf Between Non-GAAP and GAAP
|
Ticker
|
Company
|
Percent Female Board
|
CEO Gender
|
2016 EPS Non-GAAP
|
2016 EPS GAAP
|
2016
Gulf
|
|
EGL
|
Engility Holdings, Inc.
|
10.0
|
Female
|
2.2
|
-7.0
|
9.26
|
|
HTZ
|
Hertz Global Holdings, Inc.
|
28.6
|
Female
|
0.5
|
-5.9
|
6.34
|
|
CIT
|
CIT Group Inc.
|
38.5
|
Female
|
1.8
|
-4.3
|
6.09
|
|
MYL
|
Mylan N.V.
|
30.8
|
Female
|
4.9
|
0.9
|
3.97
|
|
WEX
|
WEX Inc.
|
16.7
|
Female
|
4.6
|
1.5
|
3.14
|
|
NDAQ
|
Nasdaq, Inc.
|
25.0
|
Female
|
3.7
|
0.6
|
3.03
|
|
NSR
|
NeuStar, Inc. Class A
|
30.0
|
Female
|
5.7
|
3.0
|
2.65
|
|
DV
|
DeVry Education Group Inc.
|
30.0
|
Female
|
2.4
|
-0.1
|
2.46
|
|
VRTV
|
Veritiv Corp
|
28.6
|
Female
|
3.9
|
1.7
|
2.18
|
|
MSGN
|
MSG Networks Inc. Class A
|
0.0
|
Female
|
2.2
|
0.1
|
2.06
|
*All EPS values were pulled for the most recent fiscal year as of 3/7/2017.
While there can be a legitimate need for adjustments to normalize earnings, it is an interesting observation to see the difference in the magnitude in the sum of adjustments between companies led by men and women. The SEC may find that the problem of undue prominence on Non-GAAP earnings lessens as State Street’s call for diversification pushes for a pipeline of developed women leaders.
