

Last week in the series, we discussed how lack of excess return on actively managed portfolios is not purely a function of stock selection. Regardless of strategy employed, however, intelligent portfolio construction can help improve performance, and through the processes discussed in this series, can aid in the transition from pure research to portfolio construction.
We’ve already walked through our process for modeling alpha estimates across global equities. Here, we’ll discuss mean-variance optimization techniques, and how to translate our findings into an investable portfolio.
Related: Moving from Research to Construction: Stock Selection
In order to measure the efficacy of our signal, we back-tested our results using FactSet Alpha Testing. We grouped our universe into quintiles and rebalanced monthly for 10 years. The first quintile represents the top 20% of securities based on high alpha estimates, and the fifth quintile is comprised of the 20% of securities with the worst alpha estimates. The chart below highlights the cumulative equal weighted return of each quintile relative to the benchmark.
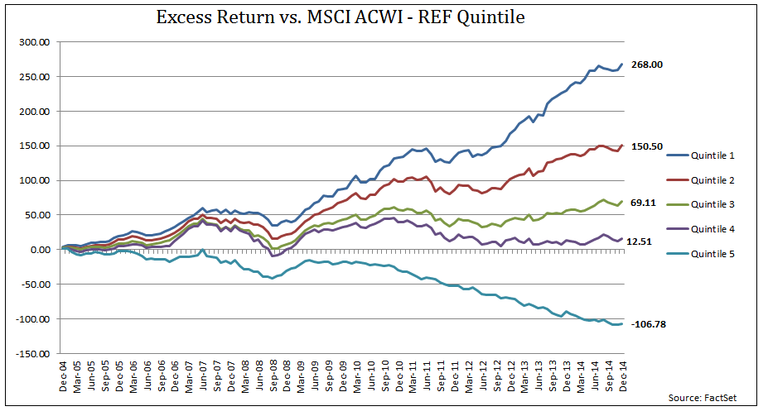
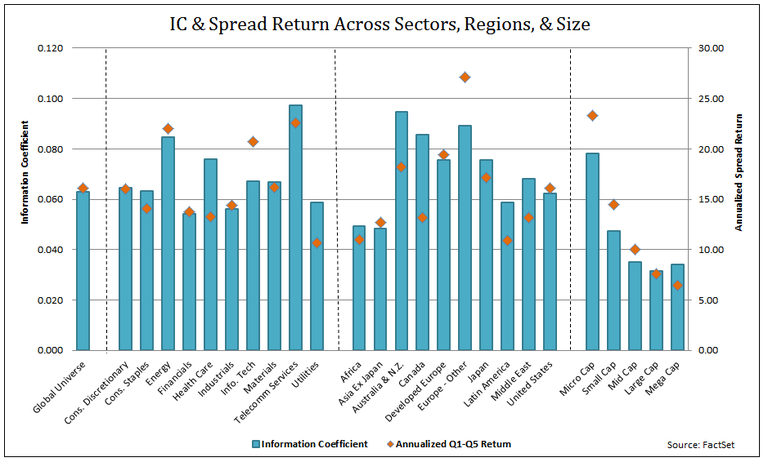
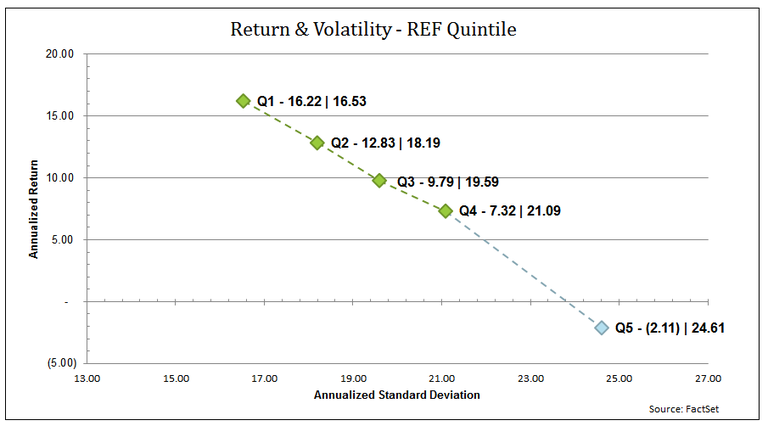
As we can see, there is a clear monotonic relationship between our alpha estimate and forward returns, with the top quintile producing 268% of outperformance over ten years. The following graphs illustrate the Information Coefficient and Spread (Long Q1 / Short Q5) Returns across GICS Sectors, Regions, and Size buckets, as well as the risk return tradeoff between investing in the various quintile portfolios.
We can then conclude that our stock selection framework does what it’s supposed to do: pick good stocks. When weighting equally, ignoring liquidity, transaction costs, and other real-world investment constraints, the Q1 portfolio does exceptionally well over the 10-year period analyzed. Our next task is to transition from signal to portfolio while hopefully achieving similar performance results.
How can we build an investable portfolio, through time, that harnesses the strength of our stock selection model? Our portfolios are constructed under the Markowitz mean-variance optimization framework, which seeks to maximize a utility function while adhering to portfolio constraints. We also attempt to minimize factor alignment problems through the use of the Alpha Alignment Factor approach presented by Saxena and Stubbs in 2010. We utilize the Axioma Portfolio Optimizer and Risk Models integrated within FactSet, as well as FactSet’s Portfolio Simulation utility to historically back-test the portfolios over 10 years. Our base case optimization is formulated as follows:
Model Inputs
Objective
Constraints
In addition to our base case portfolio, we augment our strategy using the following methods.
First, we employ a statistically based risk model to control active risk in the portfolio. Statistical risk models are mathematical constructs responsible for observed correlations in asset returns. Unlike fundamental risk factors, statistical factors have no descriptive value and are often referred to as “Blind Factors.” While essentially useless for attributing volatility, statistical risk factors are not confined to the definitions of fundamental factors and can thus dynamically pick up systematic effects in the market as they evolve and/or are beyond the scope of pre-defined factors. Statistically-based risk models have been shown to improve ex-post results in optimized portfolios in research conducted by Guerard, Markowitz, and Xu in 2013. See the 2010 version of the Axioma Risk Model Handbook for further detail regarding Axioma Statistical Risk Models.
Our second approach is to budget risk at the security level. Risk budgeting involves limiting the contribution to absolute or active risk from a set of assets or group of assets in the portfolio. Our “Risk Budget” portfolio incorporates a statistical risk model and limits any single security from contributing more than 8% of the portfolio’s total tracking error. Our last improvement to the base case is to incorporate transaction cost management into the utility function of the optimization model. Our new utility function considers the tradeoff between expected return and transaction costs.
Our final portfolio incorporates a statistical risk model, risk budget constraint, and transaction cost variable within our utility function.
Next week in the final installment of this series, we’ll review ex-post performance results across all of our portfolios, and we’ll leave you with some thoughts regarding further enhancements to the portfolio construction process through the use of exogenous factors and shifting market regimes.
Read part one of the series: Moving from Research to Construction: Stock Selection
Insight/Author%20Bios/Bijan%20Beheshti%20Insight.jpg)
Mr. Bijan Beheshti is Senior Vice President, Global Director of Analytics and Trading Sales at FactSet. In this role, he oversees strategic initiatives and facilitates growth across the Analytics and Trading business. Prior to his current role, Mr. Beheshti served as Director of Global Quantitative Analytics. He joined FactSet in 2010 and spent the last twelve years working across multiple business functions within the organization. His research has been published in the Journal of Portfolio Management, Journal of Investing, International Journal of Forecasting, and Frontiers in Applied Mathematics and Statistics. Mr. Beheshti earned his bachelor’s degree in economics from the University of California, Los Angeles and is a CFA charterholder, Certified Public Accountant, and Certified FRM.

Stress Testing Amid Rising Fears of an AI Bubble
Explore FactSet's stress testing strategies for risk managers amid AI bubble concerns, comparing current market sell-offs to the...
Stress Testing Investment Strategies: Combining Historical Data and Projected Assumptions (Podcast)
Explore portfolio stress testing to assess risk, including appropriate shock factors, historical scenarios and data, and your own...
Stress Test Your Portfolio Using 1990 and 2003 Middle East Conflict Scenarios
Explore how to leverage two FactSet hypothetical scenarios based on historical Middle East conflicts and stress test your...
Geopolitical Risk Scenarios: Stress Testing Investment Strategies Amid the War in Iran
Stay ahead of evolving markets with a stress testing module from FactSet. Use it as your starting point and build in your...
The information contained in this article is not investment advice. FactSet does not endorse or recommend any investments and assumes no liability for any consequence relating directly or indirectly to any action or inaction taken based on the information contained in this article.
