

While active management has undergone a lot of scrutiny in recent years for charging high fees and delivering little to no alpha, research like Mezrich and Ishikawa’s 2015 paper Your Fund Managers Really Can Pick Stocks shows that active managers do tend to pick good stocks.
If stock selection isn’t the problem, what explains the lack of excess return? There are countless ways for investors to quantify their convictions in securities across an investable universe, but regardless of where the strategy lies within the fundamental-quantitative spectrum, a lack of intelligent portfolio construction can materially impair portfolio managers’ ability to realize the potential of their stock selection process.
Related: A Quant's Approach to Getting Sentimental about Security Selection
In this and future articles, we’ll explore and seek to improve the transition between security research and portfolio construction. For now, let’s walk through our process for modeling alpha estimates across global equities.
In order to identify strong investment opportunities, we start by analyzing a set of stock characteristics and distilling these down into sought-after qualities.
Let’s focus our analysis on factors with strong statistical significance, persistent returns across multiple horizons, high information coefficients, low volatility in factor returns, and, most importantly, whether or not the underlying characteristics represent what a rational investor would seek in a company.
After evaluating over 70 factors across the MSCI AC World Index, we filtered down to a list of 47. The remaining factors are winsorized based on each signal’s distribution of observations. We neutralize for sector bias, alter non-applicable data to reflect either poor or median scores depending on the signal, and finally re-fit exposures to be within -5 and +5 standard deviations apart from the mean. These normalized factors are then categorized into the following attributes: Market, Value, Profitability, Solvency, Growth, Quality, Sentiment, and Efficiency.
In other words, we’ve taken a global opportunity set and assigned exposures to each security which represent the degree to which they are a good value, produce profits, run an efficient business, have strong sentiment behind them, and so forth.
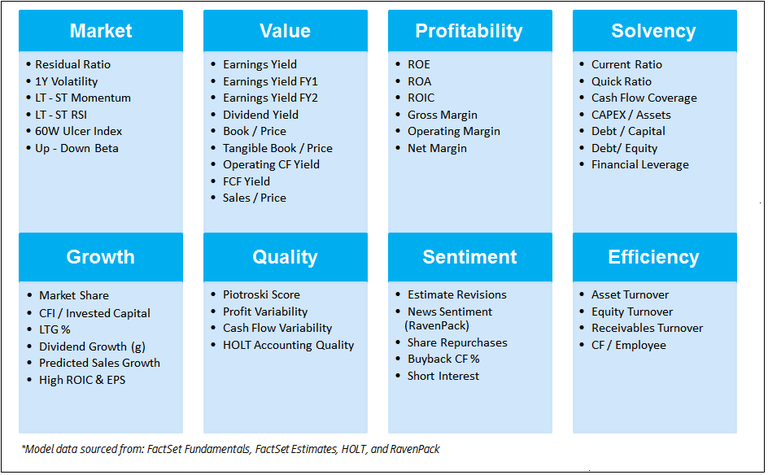
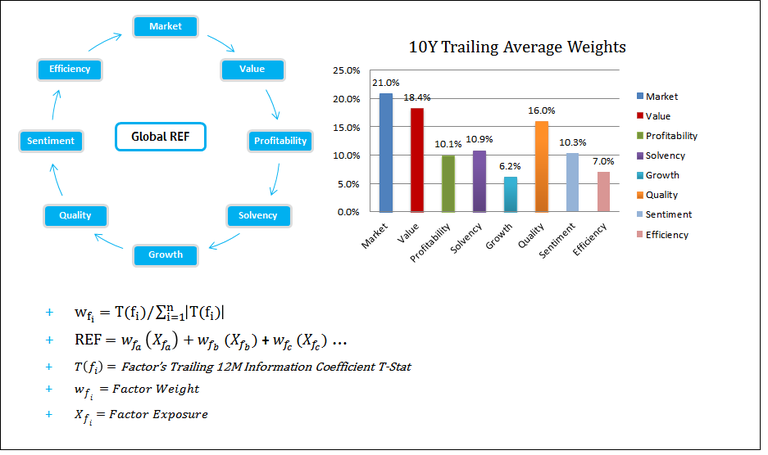
We’re now left with eight composite factors that represent what a rational investor would look for in an investment opportunity. It’s desirable to buy a company with a quality balance sheet, growth potential, high efficiency, solid profitability, that is solvent, and all this trading at a good value. Unfortunately, these characteristics don’t all pay off at the same time. In fact, there are extended periods when certain styles, such as value or growth, are punished.
Highly solvent names generally don’t produce high returns, but avoiding stocks with poor solvency scores can vastly improve performance during periods of market turmoil (such as the ’08 Credit Crisis). In order to model consistently reliable Alpha estimates for stocks in our investment universe, we employ a dynamic weighting scheme that rotates and re-weights our composite factors monthly, with emphasis placed on those that are currently exhibiting strong momentum of statistical significance. We call this the Robust Equity Factor (REF).
In part two, we’ll discuss mean-variance optimization techniques and how to translate our findings into an investable portfolio.
Read part two of this series: Moving from Research to Construction: Evaluating Performance

Insight/Author%20Bios/Bijan%20Beheshti%20Insight.jpg)
Mr. Bijan Beheshti is Senior Vice President, Global Director of Analytics and Trading Sales at FactSet. In this role, he oversees strategic initiatives and facilitates growth across the Analytics and Trading business. Prior to his current role, Mr. Beheshti served as Director of Global Quantitative Analytics. He joined FactSet in 2010 and spent the last twelve years working across multiple business functions within the organization. His research has been published in the Journal of Portfolio Management, Journal of Investing, International Journal of Forecasting, and Frontiers in Applied Mathematics and Statistics. Mr. Beheshti earned his bachelor’s degree in economics from the University of California, Los Angeles and is a CFA charterholder, Certified Public Accountant, and Certified FRM.

Total Portfolio Approach: The Plumbing Beneath the Philosophy
Explore this FactSet perspective on the total portfolio approach. Learn factors to consider if you want to effectively...
Gold Mining Equity Analysis with the Custom Risk Module
Explore the process to build a bespoke risk model in this FactSet analysis, including data gathering, exposure outlier treatment...
Stress Testing Amid Rising Fears of an AI Bubble
Explore FactSet's stress testing strategies for risk managers amid AI bubble concerns, comparing current market sell-offs to the...
Stress Testing Investment Strategies: Combining Historical Data and Projected Assumptions (Podcast)
Explore portfolio stress testing to assess risk, including appropriate shock factors, historical scenarios and data, and your own...
The information contained in this article is not investment advice. FactSet does not endorse or recommend any investments and assumes no liability for any consequence relating directly or indirectly to any action or inaction taken based on the information contained in this article.
