The upcoming first round of the French presidential elections is on the radar of the global investment community. Although the new president of France will not be elected on the first round, its outcome seems critical for the future path of France and the EU.
A victory by far-right leader Marine Le Pen or far-left leader Jean-Luc Mélenchon is seen by many investors as potentially fatal for the euro and even the EU itself. This is a political risk and the outcome of the election is quite difficult to predict by means of historical events or the standard tools for measuring and forecasting market risk (as mentioned in Unpredictable French Elections Stir Another Disruption to Markets).
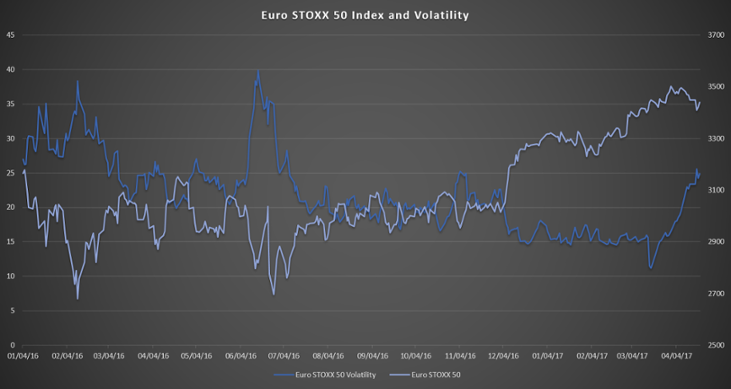
As an example, let’s look at the Euro STOXX 50 index and its Volatility Index (Euro STOXX 50 Volatility Index). Euro STOXX 50 is a key indicator of the eurozone leading companies’ performance. The index futures and options are among the most liquid equity derivatives globally. That is why the Euro STOXX 50 Volatility Index seems to provide a good indication of the market participants’ expectation on the European stock prices’ volatility. Historically, the correlation between the index returns and the volatility index changes has been strongly negative. Usually, jumps in the volatility index are associated with significant turbulence and drops in the index level.

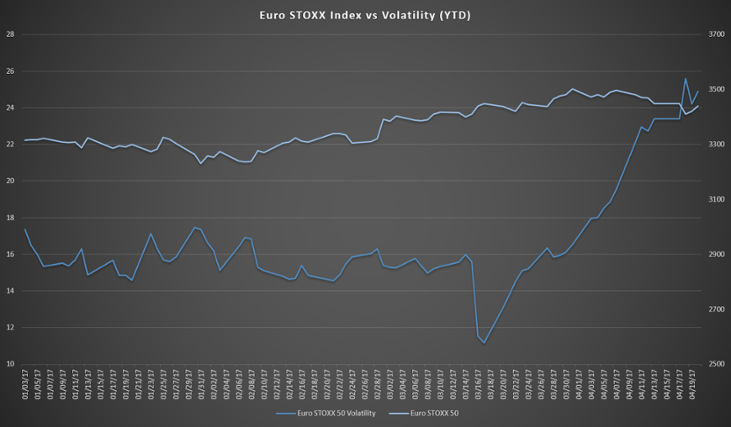
In the recent month or so, one can see that the Volatility index started to increase, i.e. the investors expect more turbulent periods after the French election. However, at the same time one does not observe significant realized volatility or drops in the index level itself. This is better seen below where the YTD values are plotted.

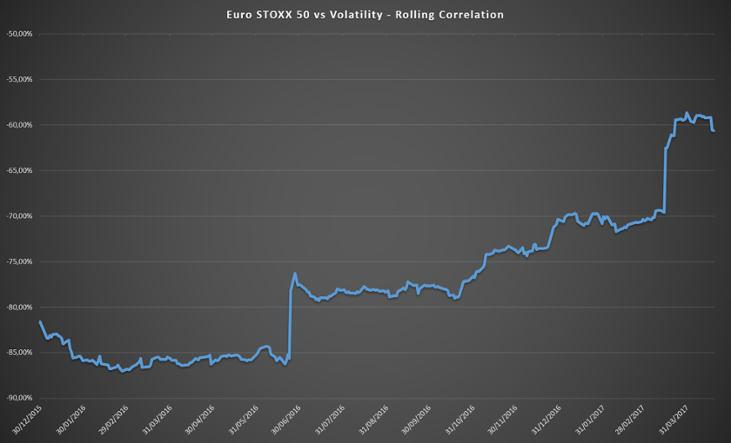
The rolling historical correlation between the Euro STOXX 50 index returns and its Volatility index since January 2016 is plotted in the chart below. Clearly, they have become more and more independent recently. The recent correlations are at their lowest value historically.

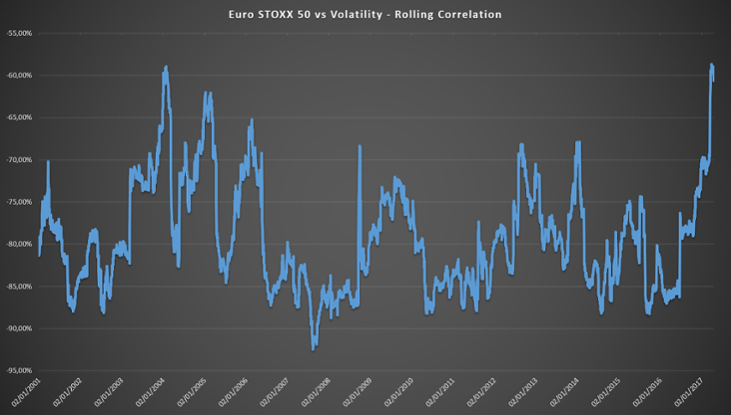
The chart below plots the rolling correlation since January 2001 and one can see that there is only one similar period with less correlation – lower than -60%. Also, the recent upward trend is the most pronounced in the history of the euro, pointing to the possibility of an exceptional event for the common currency.

This again comes to confirm that there is high uncertainty in the outcome of the French elections and financial risks they can trigger, but this uncertainty is not observed in the current major European equity prices, represented by Euro STOXX 50.
This post originally ran on the BISAM INSIGHTS BLOG. FactSet announced the acquisition of BISAM on March 20, 2017. Read the press release.
