

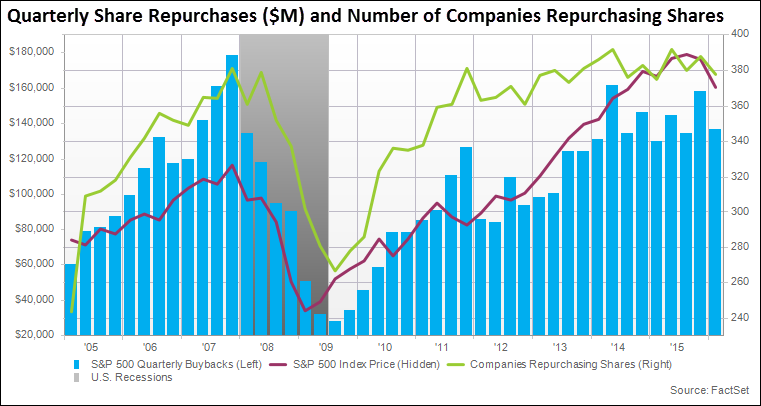
Companies in the S&P 500 spent $136.6 billion on share buybacks during the fourth quarter. This represented a 5.2% increase in spending from the year ago quarter and a 13.5% decline from Q3. Historically, a sequential decline from Q3 to Q4 has not been uncommon due to the seasonality of buybacks. Going back to 2005, Q4 has averaged the lowest quarterly dollar-value buybacks, while Q3 has averaged the largest quarterly dollar-value buybacks.
Despite the quarter-over-quarter decline, aggregate buybacks in Q4 2015 still marked the sixth highest quarterly amount since the start of 2005. It also represented the third highest post-recession total after the $157.9 billion worth of buybacks in Q3 2015 and $146.6 billion in Q3 2014. The number of companies participating in buybacks during Q4 increased to 378 from 375 in the year ago quarter. The buyback participation was 388 companies in Q3..
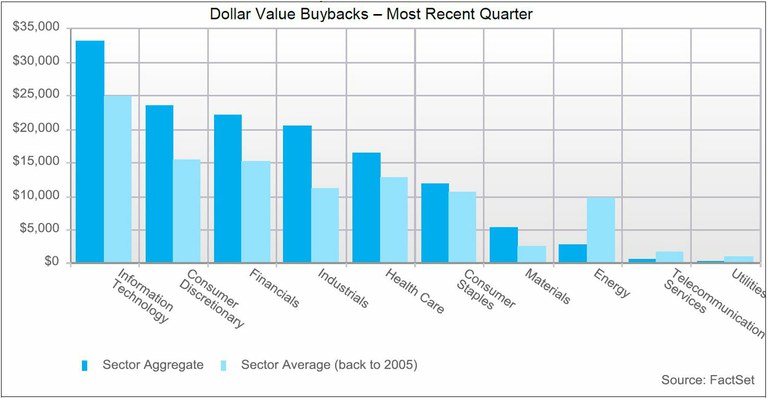
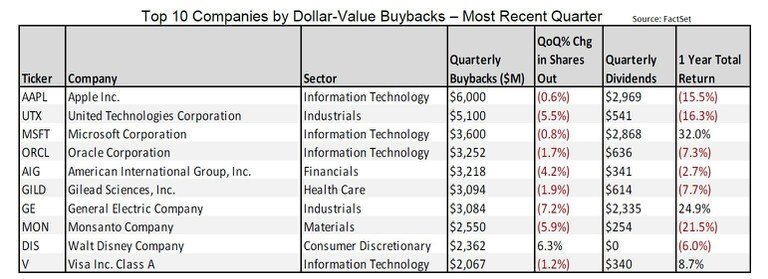
The Information Technology sector was the top spending group in terms of dollar-value buybacks (similar to Q3). Companies in the sector spent $33.2 billion on buybacks during Q4. Four out of the top 10 companies ranked by quarterly dollar-value buybacks were in this sector (Apple, Microsoft, Oracle, and Visa).
Expanding the list to the top 25 reveals some additional well-known names in the Information Technology sector, such as QUALCOMM, Alphabet, and Cisco Systems. Each of these firms repurchased over $1.5 billion worth of its own shares in Q4. It is interesting to note that the Information Technology sector was also the second highest sector in terms of year-over-year reduction in common shares outstanding. Aggregate shares outstanding for the sector declined 2.9%. The only sector to post a larger reduction in common shares outstanding in Q4 was the Industrials sector.
Apple was once again the top spender on buybacks in Q4. The iPhone-maker repurchased $6 billion worth of shares, with half of the purchases coming from its accelerated share repurchase program and half being bought in the open market. It is interesting to note that in the past quarter, Apple paid a 13% premium to buy back its shares relative to its average daily price for the quarter. This was the second highest premium paid by an S&P 500 company that spent more than $100 million on buybacks during the quarter. Online security firm Symantec was the only company that paid a higher premium for its shares.
Two newcomers to the top 10 list of buyback spenders were General Electric and United Technologies. Both are part of the Industrials sector, which was the top sector in terms of year-over-year growth in quarterly buybacks.
General Electric repurchased $3.1 billion worth of its shares in Q4 as a part of its historic $50 billion buyback program that was announced last April. In addition to the repurchase program, GE completed a stock swap with the former GE Capital retail finance division, Synchrony Financial, which had an effect on shares outstanding that was equivalent to a $20.4 billion buyback. As a result, the shares outstanding for General Electric were reduced by 6.7% in the last 12 months.
United Technologies is also part of the Industrials sector and provides products and services to the building systems and aerospace industries. UTX repurchased $5.1 billion worth of shares in Q4 as a part of its $6 billion accelerated share repurchase program launched in November.
The Industrials sector led all major buyback sectors (excluding the Telecom and Utilities sectors, which have each averaged less than $2 billion in quarterly buybacks since 2005) in terms of year-over-year growth (+43.8%) in quarterly buybacks. The Consumer Discretionary sector came in second with a growth rate of 25.8%. Six out of the eight buyback groups posted positive year-over-year growth in Q4, with the Industrials, Consumer Discretionary, and Health Care sectors each achieving double-digit growth. The Consumer Staples and Materials sector saw a very slight year-over-year uptick in buybacks, but for all intents and purposes, quarterly buybacks in these sectors were essentially flat compared to the year ago quarter.
Within the Industrials sector, United Technologies, General Electric, American Airlines, and FedEx Corporation were the top contributors to growth. As previously mentioned, UTX and GE led the buyback spending in Q4 with $5.1 billion and $3.1 billion worth of shares repurchased, respectively, compared to just $405.3 billion and $148.6 billion in the year ago quarter. American Airlines and FedEx also helped lift the dollar-value buybacks total for the Industrials sector in Q4. American Airlines increased its buyback spending by nearly $500 million from Q4 2014 and FedEx added over $750 million compared to a year ago.
It is interesting to note that aggregate common shares outstanding for the Industrials sector were reduced by nearly 5% year-over-year, which was the largest reduction in shares of all the sectors. Within the Consumer Discretionary sector, Walt Disney was the top contributor to growth. The media and entertainment company bought back $2.4 billion worth of its own shares in Q4, which was over $1 billion more than its buyback spending in the year ago quarter. Keep in mind that Disney was the fourth biggest spender on repurchases in Q3, when dollar-value buybacks for the firm hit its highest level in 10 years. Several other contributors to year-over-year growth in the Consumer Discretionary sector were Target, General Motors, and Home Depot.
The dollar amount spent on share buybacks for the trailing 12 months ending in Q4 totaled $568.9 billion, which marked a 0.5% decline year-over-year but was nearly flat with Q3. Trailing 12 month buybacks made up 68.1% of net income at the end of the quarter. This was an uptick from the S&P 500 ratio a year ago and a quarter ago (64.9% and 58.6%). With repurchases not changing much on a TTM basis, the driver of this climbing ratio can once again be attributed to the continued decline in earnings. The year-over-year earnings decline for the S&P 500 was 3.5% in Q4 2015. The fourth quarter marked the first time that the S&P 500 has seen three consecutive quarters of YoY earnings declines since Q1 2009 through Q3 2009. Analysts do not expect earnings growth to return until Q3 2016. Additional analysis on earnings trends can be found in our weekly Earnings Insight.
Free cash flow is often viewed as a better measure of liquidity for a company than earnings. Previous versions of this report have defined free cash flow as cash flow from operating activities minus fixed capital expenditures minus dividends paid (“free cash flow after dividends.”) The dollar amount spent on share buybacks for the trailing 12 months ending in Q4 represented 101.7% of free cash flow after dividends. This was a huge jump from the year ago quarter when the ratio was 81.6%. Free cash flow can also be calculated prior to dividends being paid out (“free cash flow” or “free cash flow before dividends”).
The TTM dollar-value buybacks represented 58.3% of free cash flow before dividends in Q4, which marked a 10% jump year-over-year and a 6.4% increase quarter-over-quarter. It was the second highest post-recession ratio after Q2 2015, when the ratio hit 58.4%. On a trailing 12 month basis, dollar-value buybacks only slightly declined year-over-year, so the real driver of this rising ratio has been decreasing free cash flow. Aggregate free cash flow for the S&P 500 dropped 9.5% year-over-year.
A big contributor was the negative free cash flow logged by the Energy sector due to slumping commodity prices. But even if the Energy sector were excluded from the index, the ascending buyback to free cash flow ratio of the S&P 500 would still be evident. The Industrials sector saw the largest year-over-year increase in this ratio, as it climbed to 85.6% by the end of Q4 from 71.1% in Q4 2014. American Airlines, 3M, and FedEx were three of the contributors in the Industrials sector, with each company spending more on buybacks in the TTM than they generated in free cash flow before dividends.
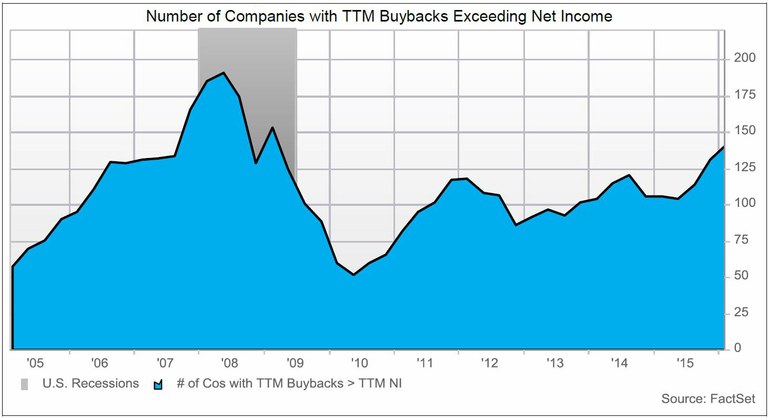
In the trailing 12 months ending in Q4, the number of companies that were spending more on buybacks than the amount generated in free cash flow before dividends reached 147. This was 14 more than the count a year ago and well above the average going back to 2005 (124 companies). The Consumer Discretionary contained 33 companies in which TTM buybacks exceeded free cash flow. This was an uptick of seven firms from a year ago. The Industrials sectors came in second with 24 companies, which was nine more than a year ago.
The buyback yield for the S&P 500 in Q4 remained below the quarterly average going back to 2005. The trailing 12 months shares repurchased represented 2.97% of the aggregate shares outstanding in the index.
Relative to shares outstanding, the Information Technology sector was the most active buyer of its own shares in the TTM ending in Q4, despite a sequential and year-over-year decline in the ratio. The sector’s trailing 12 month share repurchases amounted to 4.4% of the sector’s aggregate shares outstanding over the period. The Industrials sector had the second highest buyback yield of all groups (3.8%). Five of the top 10 S&P 500 companies ranked by TTM buyback yield were in these sectors. Quanta Services topped the list, as it repurchased 37.3% of its shares outstanding, which helped contribute to a 26.8% year-over-year reduction in the firm’s shares count. As a whole, the aggregate number of shares outstanding for the S&P 500 at the end of Q4 increased 0.6% year-over-year, but was still slightly below its 10 year average going back to 2005.
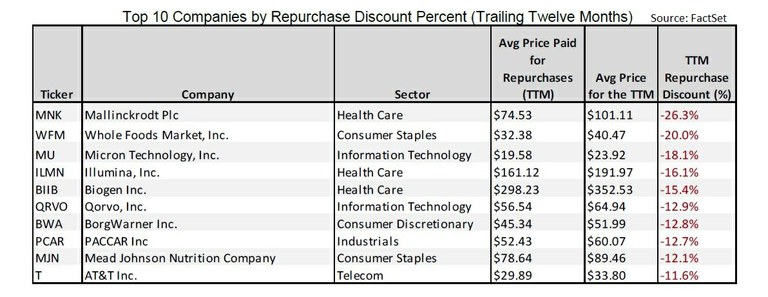
To find companies that have repurchased shares during periods of depressed prices, we examined companies’ average price paid for repurchases over the quarter and the trailing 12 months and compared that to their average stock price over the same period. Based on this analysis, Southwest Airlines and DuPont bought back their shares at the largest discount in the most recent quarter (12.2% discount and 9.7% discount.) Mallinckrodt Plc and Whole Foods Market repurchased their shares at the largest discount in the trailing 12 months ending in the most recent quarter (26.3% discount and 20% discount).
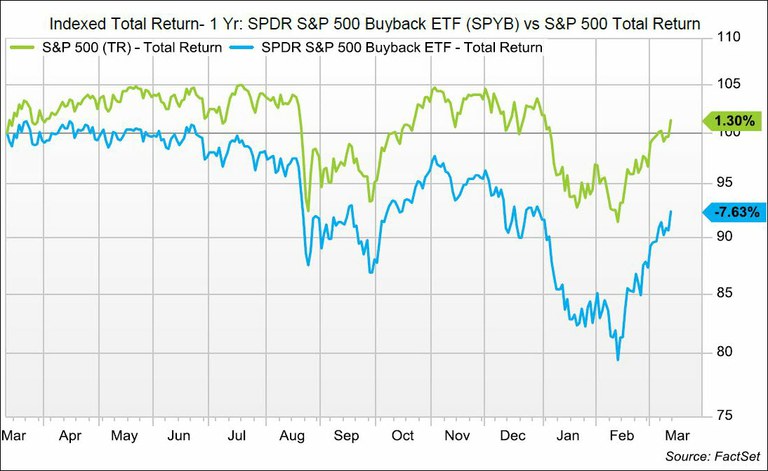
To analyze the performance of companies repurchasing stock, we used the SPDR S&P 500 Buyback ETF (SPYB) and the PowerShares Buyback Achievers Portfolio ETF (PKW). These are two of the most well-known exchange traded funds for investors looking for exposure exclusively to companies repurchasing shares. The SPYB tracks the S&P 500 Buyback Index, which provides exposure to the 100 constituents of the S&P 500 with the highest buyback ratio in the TTM. The PKW tracks the NASDAQ US Buyback Achievers Index, which is comprised of US securities issued by corporations that effected a net reduction in shares outstanding of 5% or more in the TTM.
In Q4 (October 31, 2015-January 31, 2016) and over the past year, the total return of the buyback ETFS trailed that of their benchmark indices. The SPYB was down 13% in the fourth quarter and 7.6% in the past year on a total return basis, while the S&P 500 Total Return index only decreased 6.2% in Q4 and gained 1.3% in the past year. The PKW decreased 9.7% in Q4 and 6.4% in the past year, while the NASDAQ Composite was down 8.4% in Q4 and 0.9% in the past year. Looking at a three year time horizon, the PKW gained 38.8%, but still lagged the performance of the NASDAQ Composite, which was up 51.4% over the same time period.
When separating out buyback spenders and non-buyback spenders in the S&P 500 and analyzing performance, buyback spenders saw an average monthly equal weighted return of -0.91% in the past year. This trailed the non-buyback spenders’ return of -0.81% in the past year. This performance analysis can also be done using a market-cap weighted cumulative return and measured relative to the S&P 500 Total Return index. In the past year, companies repurchasing shares saw an excess weighted cumulative return of -1.9% relative to the benchmark, while companies not repurchasing shares saw a return of 9.8% relative to the benchmark. Extending the time frame to three years, buyback spenders had an average equal weighted monthly return of 0.8% and non-buyback spenders had an average return of 0.65%. On a market cap weighted cumulative return basis relative to the S&P 500 Total Return index, companies not repurchasing shares outperformed the buyback spenders over a three year time frame, similar to the one year time horizon (11.5% vs -2.9%).
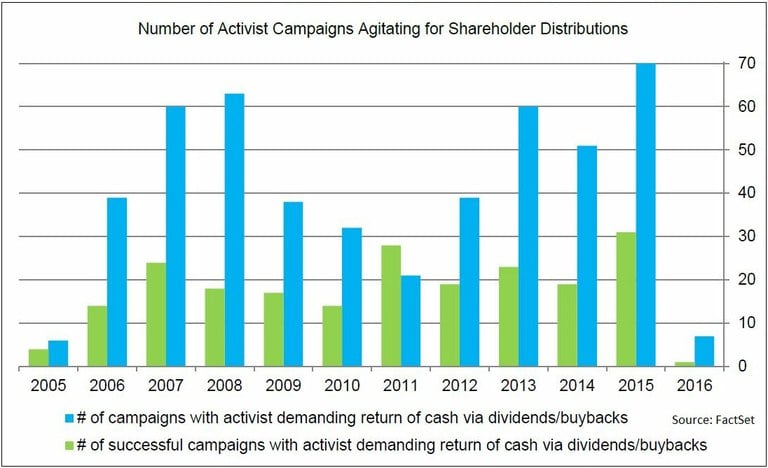
Even with shareholder buybacks and dividend distributions for companies in the S&P 500 hovering near record levels, activist investors have continued to push for more. In 2015, there were 70 activist campaigns in which a dissident objective was to return cash via dividends and/or buybacks. This was a 37% increase from the number in 2014 (51 campaigns), and represented the highest total since FactSet began tracking the data in 2005.
Of these 70 activist campaigns in 2015, the activists were successful in 31 campaigns, which was another record high. Examples of success include: the company declaring a special one-time dividend, increasing its regular dividend, announcing a new share repurchase program, and expanding its existing share repurchase program. So far in 2016, there have been seven total campaigns in which a dissident objective was to return cash via dividends and/ or buybacks. One of these campaigns has been successful.

S&P 500 Reporting Highest Net Profit Margin in More Than 15 Years
Explore S&P 500 Q2 results in this FactSet earnings report. Use our quantitative analysis for insight on net profit margins at...
Alphabet Drives S&P 500 Earnings Growth to Highest Level Since 2021 On Valuation Gains
FactSet S&P 500 earnings analysis: Explore the sectors and companies with the largest contribution to earnings growth in Q2.
S&P 500 Earnings Season Update: July 24, 2026
FactSet report on S&P 500 earnings: Explore Q2 earnings season results, including an unusually large EPS beat, earnings growth,...
Are “Magnificent 7” Companies Still Top Contributors to S&P 500 Earnings Growth for Q2?
Explore our FactSet S&P 500 earnings report for the Mag 7 trends in Q2 earnings growth. Learn which companies are top-5...
The information contained in this article is not investment advice. FactSet does not endorse or recommend any investments and assumes no liability for any consequence relating directly or indirectly to any action or inaction taken based on the information contained in this article.

