

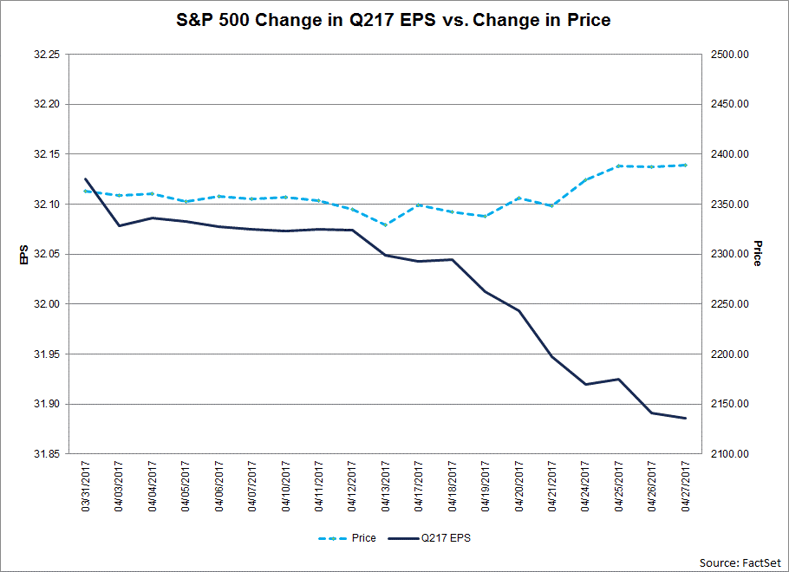
During the month of April, analysts lowered earnings estimates for companies in the S&P 500 for the second quarter. The Q2 bottom-up EPS estimate (which is an aggregation of the EPS estimates for all the companies in the index) dropped by 0.7% (to $31.89 from $32.12) during this period. How significant is a 0.7% decline in the bottom-up EPS estimate during the first month of a quarter? How does this decrease compare to recent quarters?
During the past year (four quarters), the average decline in the bottom-up EPS estimate during the first month of a quarter has been 1.5%. During the past five years (20 quarters), the average decline in the bottom-up EPS estimate during the first month of a quarter has been 2.3%. During the past 10 years, (40 quarters), the average decline in the bottom-up EPS estimate during the first month of a quarter has been 2.5%. Thus, the decline in the bottom-up EPS estimate recorded during the first month of the second quarter was smaller than the one-year, five-year, and 10-year averages.
In fact, this marks the smallest decline in the bottom-up EPS estimate for the index for the first month of the quarter since Q2 2014 (-0.2%).
At the sector level, eight sectors recorded a decline in their bottom-up EPS during the first month of the quarter smaller than the five-year average and 10-year average for that sector. One sector that stands out from the pack in terms of below average cuts to estimates is the Materials sector. This sector recorded a decrease in the bottom-up EPS estimate of 1.0% (to $5.00 from $5.05) during the first month of the second quarter. This 1.0% decrease is much smaller than the average decline of 8.0% over the past five years and the average decline of 9.0% over the past ten years in the bottom-up EPS estimate for this sector during the first month of the quarter.
As the bottom-up EPS estimate for the index declined during the first month of the quarter, the value of the S&P 500 increased during this same period. From March 31 through April 28, the value of the index increased by 1.1% (to 2388.77 from 2238.83). Assuming the closing price of the index for today is above 2238.83, this will mark the thirteenth time in the past 20 quarters in which the bottom-up EPS estimate decreased during the first month of the quarter while the value of the index increased over this same period.


Mr. John Butters is Vice President and Senior Earnings Analyst at FactSet. His weekly research report, “Earnings Insight,” provides analysis and commentary on trends in corporate earnings data for the S&P 500 including revisions to estimates, year-over-year growth, performance relative to expectations, and valuations. He is a widely used source for the media and has appeared on CNBC, Fox Business News, and the Business News Network. In addition, he has been cited by numerous print and online publications such as The Wall Street Journal, The Financial Times, The New York Times, MarketWatch, and Yahoo! Finance. Mr. Butters has over 15 years of experience in the financial services industry. Prior to FactSet in January 2011, he worked for more than 10 years at Thomson Reuters (Thomson Financial), most recently as Director of U.S. Earnings Research (2007-2010).

S&P 500 Reporting Highest Net Profit Margin in More Than 15 Years
Explore S&P 500 Q2 results in this FactSet earnings report. Use our quantitative analysis for insight on net profit margins at...
Alphabet Drives S&P 500 Earnings Growth to Highest Level Since 2021 On Valuation Gains
FactSet S&P 500 earnings analysis: Explore the sectors and companies with the largest contribution to earnings growth in Q2.
S&P 500 Earnings Season Update: July 24, 2026
FactSet report on S&P 500 earnings: Explore Q2 earnings season results, including an unusually large EPS beat, earnings growth,...
Are “Magnificent 7” Companies Still Top Contributors to S&P 500 Earnings Growth for Q2?
Explore our FactSet S&P 500 earnings report for the Mag 7 trends in Q2 earnings growth. Learn which companies are top-5...
The information contained in this article is not investment advice. FactSet does not endorse or recommend any investments and assumes no liability for any consequence relating directly or indirectly to any action or inaction taken based on the information contained in this article.
