It's been two years since the oil crash started, off its Brent peak of $115 per barrel. What began as a minor tit-for-tat between Arab blends quickly escalated into a global price war, affecting everything from policy rates to the fight against ISIS. But perhaps the most tell-tale sign of the oil drop has been the rise in the US dollar index. Since July 2014, the correlation between Brent and the US dollar index (DXY) has been -0.90.
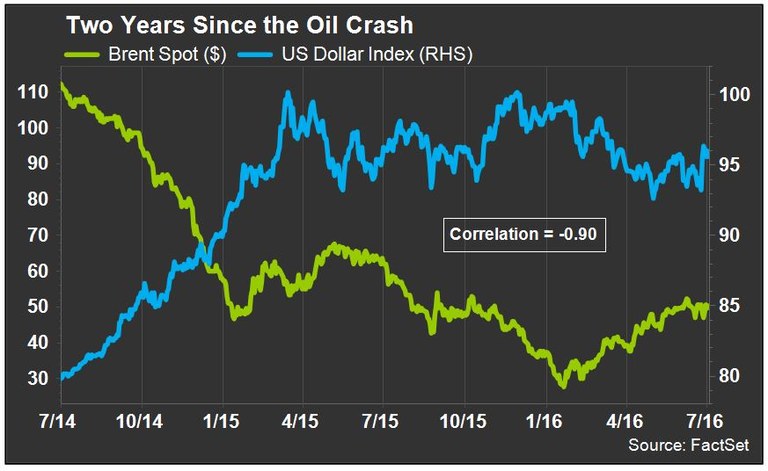
And that makes sense. Oil is priced in dollars so the two should have an inverse relationship. But after seeing headlines like “oil pops from falling dollar” so often, I decided to take a closer look. After all, correlation is not causation, and a commodity whose price is tied so directly to rig counts, inventory levels, or handshakes between a Saudi prince and a Russian diplomat cannot possibly depend on just the dollar's strength.
In fact, if you calculate the two-year rolling correlation coefficient between Brent and US dollar index monthly for the past 20 years, you get an average of -0.35. That’s a far cry from -0.90 and even incorporates three periods of positive correlation, such as the wake of the Asian financial crisis in the late 1990s. The chart below shows that the recent, highly negative correlation between oil and the dollar began only a month after oil prices began tanking.
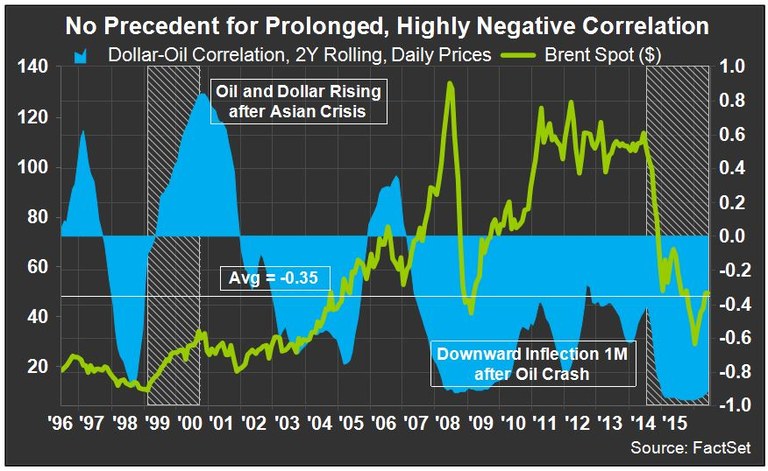
But Oil is Priced in Dollars!
Despite the seemingly interdependent nature between black gold and the greenback that we see in the markets these days, there is actually no precedent for a long-term, highly negative correlation between the two. If you want to see a strong currency-crude relationship, try the Canadian dollar. During the past 20 years, no other petro-currency had a stronger oil correlation than the USD-CAD rate, which averaged -0.62.
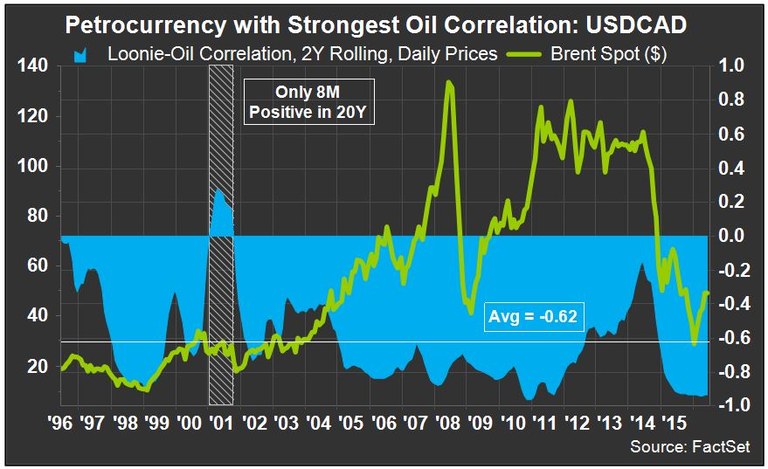
The loonie-oil correlation coefficient was positive for only eight months in the past 20 years. That’s the shortest total positive spell of 86 USD currency pairs that were analyzed. (The majority of the world’s currencies, like the Saudi riyal, have some sort of peg and were not included.)
Those 86 USD currency pairs have a median current 2Y oil correlation coefficient of -0.84. The USD-CAD rate’s coefficient is now -0.93, but the most negative results are seen in the USD-RUB and USD-NOK rates, which have coefficients of -0.97 and -0.96, respectively.
| Currency per US Dollar |
2Y Oil Correlation |
| Top 5 |
USDRUB |
Russian Ruble |
-0.97 |
| USDNOK |
Norwegian Krone |
-0.96 |
| USDPLN |
Polish Zolty |
-0.94 |
| USDCAD |
Canadian Dollar |
-0.93 |
| USDCOP |
Colombian Peso |
-0.93 |
| |
| Other Notables |
USDAUD |
Australian Dollar |
-0.92 |
| USDBRL |
Brazilian Real |
-0.88 |
| USDMXN |
Mexican Peso |
-0.88 |
| USDEUR |
Euro |
-0.87 |
| USDGPB |
British Pounds |
-0.85 |
| |
| 86-Country Median: |
-0.84 |
| US Dollar index: |
-0.90 |
The Polish Zloty?
Smackdab in the middle of the table above is an eyesore that seems to defy logic – the Polish zloty’s USD rate has had a stronger correlation to oil (-0.94) than that of the Canadian dollar (-0.93). Not even close to being an oil-dependent country like Norway or Russia, Poland has a diversified economy and trades mostly within the EU.
But the zloty has been under pressure due to political issues within the country. A new government led by the Law and Justice party has wrested a more authoritarian grip on Polish society and even imposed a bank asset tax, leading to an S&P credit downgrade in January.
To determine if the USDPLN-Brent relationship had more to do with the fact that oil is denominated in dollars, I used the currency weights that comprise the US dollar index, below, to create a custom index for the ruble, krone, zloty, loonie, and peso, in order to recalculate their two-year oil correlations.
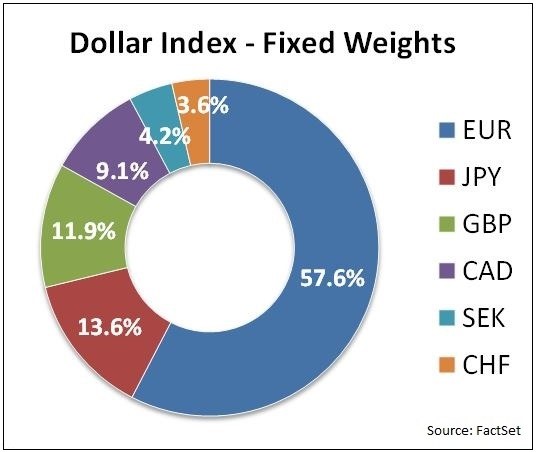
The only difference was that I had to replace the 9.1% devoted to CAD with another currency (CNY) in order to include the loonie in the analysis. If that were done to the US dollar index, the two-year dollar-oil correlation would move only from -0.90 to -0.89.
More Surprises for the Loonie Than the Zloty
By creating these custom currency indices, I mimicked the DXY for those five currencies. This removed from the correlations any direct effect from the US dollar on the value of the currencies.
For example, instead of comparing rubles per US dollar to Brent, I compared rubles per a weighted mix of euro, yen, pound, yuan, krona, and franc to Brent. Below, the results from the ex-dollar indices are placed next to the previously shown USD rate correlations.
| |
2Y Oil Correlation |
Strength Delta |
| Top 5 |
USD Pair |
Ex-Dollar Index |
Between Absolutes |
| Russian Ruble |
-0.97 |
0.97 |
-0.01 |
| Norwegian Krone |
-0.96 |
0.94 |
-0.02 |
| Polish Zolty |
-0.94 |
0.79 |
-0.15 |
| Canadian Dollar |
-0.93 |
0.63 |
-0.31 |
| Colombian Peso |
-0.93 |
0.91 |
-0.02 |
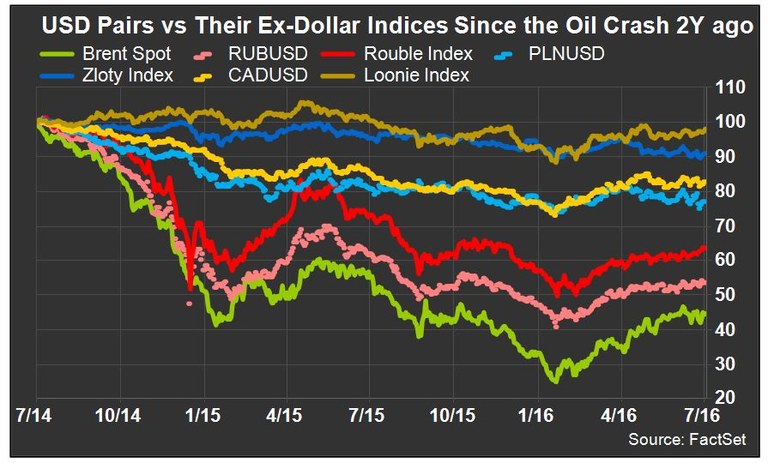
What the numbers depict is that the ruble’s custom ex-dollar index will rise (strengthen) with oil, just as much as the USD-RUB will fall (as the ruble strengthens). This is also true for the krone and peso (based on the small deltas), meaning the currency in which oil is priced isn’t as important for those petro-currencies. Whether valuing against the USD or any other currency, the ruble, krone, and peso will more often than not rise with oil.
Related: Aggregate Q1 Loss Expected for S&P 500 Energy
The zloty’s ex-dollar index on the other hand has a two-year oil correlation of only 0.79, which is below the absolute value of the 86-currency median of -0.84. This makes it more likely that the zloty-oil correlation feeds off the strong dollar-oil correlation, rather than Poland having turned into a modern-day oil power without anyone noticing.
And finally on to the loonie, the currency whose USD pair has had the strongest correlation to oil in the last 20 years. Not only is the difference between the absolute values of the two correlation methods large, the correlation between the loonie’s ex-dollar index and oil was only 0.63. To put that figure into perspective, out of the 86 USD currency pairs analyzed, all but eight had a two year oil correlation between -0.63 and -0.97.
It seems that the Canadian dollar is heavily affected by the denomination of commodities in US dollars, and you can see the two-year price developments below.
What Does This Tell Us?
- Oil and the dollar don’t necessarily need to move inversely. It’s only since the oil crash two years ago when the correlation between the two became so strong.
- The Canadian dollar has been the most reliable indicator of oil movements among the petro-currencies in the past 20 years. However, the ruble and krone have had much stronger oil correlations these past two years.
- Compared to other petro-currencies, the loonie is heavily affected by the pricing of oil in USD. The correlation between the CAD and oil is considerably weaker when non-USD crosses are analyzed.
So, yes, while this was not the case before oil peaked and most likely has more to do with the political environment in Poland, the zloty has had a stronger oil correlation than the loonie over the past few years.
