

Gold prices have taken a serious hit over the past several weeks. On July 24, the continuous futures contract for gold closed the day at $1085.50 per troy ounce, which was the lowest it has fallen since February 10, 2010, when the metal was priced at $1076.30. The continuous contract represents the most actively traded gold futures contract measured by cumulative volume and open interest. Two days prior, gold was in the midst of a 10-day slide during which it declined over 6%. The commodity has ticked up slightly since then, closing at $1089.40 on Monday, August 3, but remains well off its one-year average of $1207.15. What has caused the recent selloff in gold? Where will prices go next?
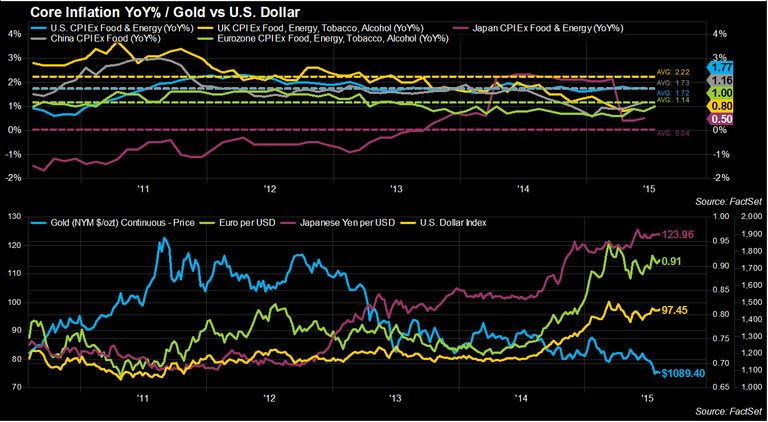
The first factor is the strength of the U.S. dollar. Gold is priced in U.S. dollars, so as the currency strengthens, it makes gold more expensive to foreign buyers, which can hurt demand outside of the U.S. As of Monday's close, one U.S. dollar was equal to 0.91 euros and 123.96 yen, giving the greenback gains of 10.28% and 3.39% on a year-to-date basis. It is also trading more than 6% above its one-year average (0.85 euros and 116.59 yen) against both currencies. The U.S. Dollar Index, which measures the value of the dollar against a basket of currencies (euro, yen, British pound, Canadian dollar, Swedish krona, and Swiss franc) has also showed strength this year. The index ended Monday at 97.45, leaving it with a 7.95% gain on a year-to-date basis and not far off its 10-year high of 100.18.
A second factor is low global inflation. Gold typically serves as a store of value and a hedge against inflation, but in this low-inflation environment, investors are looking elsewhere for a return. In June, the U.S. saw an increase in core inflation (Ex-food and energy) of 1.77% compared to the same month a year ago. Although this represents an increase from the 1.73% year-over-year gain in May, the rate still remains below the 2% target set by the Fed. Additionally, the core PCE price index, which is the inflation gauge emphasized by the Fed, came in at a tame 1.29% in June. Core Inflation (Ex-food, energy, tobacco, and alcohol) remained fairly subdued in the Eurozone as the region posted a 1% year-over year increase in July, which is still below the five-year average of 1.14% and well off of the European Central Bank's target of close to 2%. Still, the July reading was the highest in the Eurozone since April 2014. In China, core inflation (Ex-food) in June increased by 1.16% compared to the same month a year ago, which is well below its five-year average of 2.22%, while core inflation (Ex-food and energy) in Japan increased 0.50%, which is above its five-year average of 0.04%.
There are two price factors that investors should keep an eye on in the coming weeks and months: seasonality and the Fed.
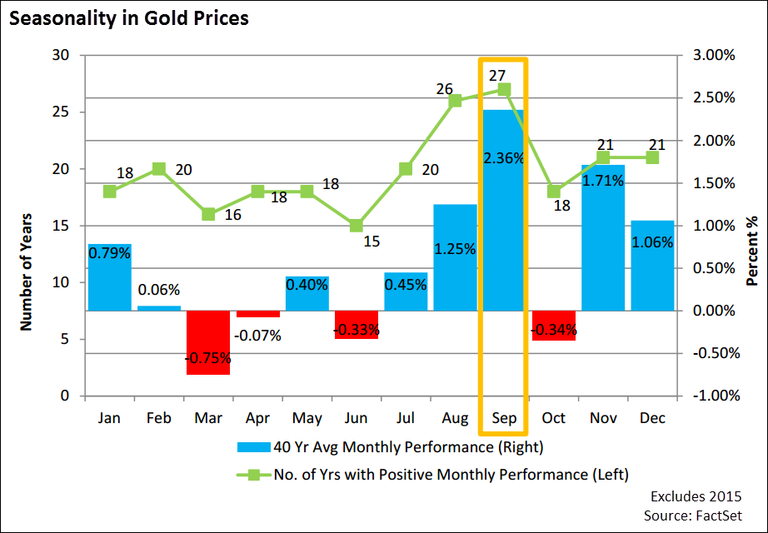
The first factor is seasonality. Unlike oil and corn, gold isn't necessarily viewed as an investment that follows a direct and obvious seasonal trend throughout the year. However, looking into historical pricing back to the mid-1970s, there do seem to be common seasonal trends for gold. According to data from FactSet's Seasonality report, September was the top performing month on average going back 40 years (excluding 2015 numbers) when it comes to gold prices. Gold saw a 40-year average monthly return of 2.36% in September, which was 38% higher than the next best performing month (November: 1.71%). Going back to 1975, gold prices in September saw a positive monthly performance in 27 out of 40 years, which was the largest number of any other month.
August was a close second with 26 years (out of 40) of positive returns. August was also the third best performing month in terms of 40-year average return, gaining 1.25% on average since 1975. It is interesting to note that the India festival and wedding seasons tend to run during the months of August, September, October, and November. During this time, Indian jewelry manufacturers often increase their consumption of gold and other metals in preparation for large consumer demand.
With India being one of the world's largest consumers of gold, this could be a possible explanation for the seasonal trends depicted in the chart below. But it's important to note that macroeconomic and geopolitical factors can play a significant role in the gold market and could have distorted or even driven some of these historical trends for past years.
The second factor that may have an impact on gold prices has been a topic of conversation on the Street for some time: the possibility that the Federal Reserve raises interest rates in September. An interest rate hike could potentially lead to further declines in gold, as investors may look to move out of zero-yielding assets like commodities and put their money into interest-bearing securities like bonds and money market funds.
How have previous U.S. interest rate hikes affected gold prices? Since 1975, there have been 106 increases to the U.S. Fed funds target rate. Looking at gold's performance at the close of trading on the announcement date of the interest rate hike and comparing it to the previous close, the price of gold has finished higher 53 times (50%). If the window on which performance is calculated is expanded to an extra day or even five days (in an attempt to account for the market already pricing in this news), gold roughly has the same number of positive days. As a result, there does not appear to be a consistent price reaction to historical interest rate hikes in the near-term.
An alternative type of analysis would be to look at historical interest rates and gold prices to determine if any meaningful correlation exists between the data sets. In order to capture daily movements, we used the one-year Treasury yield instead of the actual interest rate, as these data series have approximately a perfect positive correlation. From the start of 1975 until Monday's close, gold prices and the one-year U.S. Treasury yield had a correlation coefficient of -0.57. If the bull market for gold from 1975 to 1981 is excluded, when gold and yields moved in tandem to the upside (0.79 correlation coefficient), the negative correlation strengthens to -0.65. Therefore, based on this analysis, there does seem to be an inverse relationship between the two data sets, although not a particularly strong one.
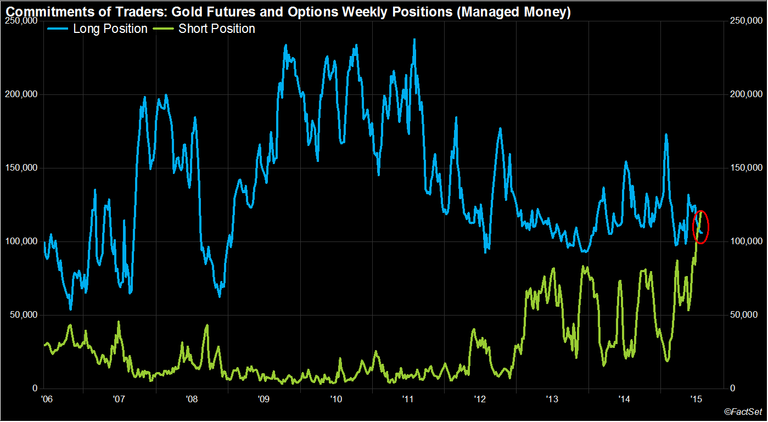
On Friday, July 24, the Commodity Futures Trading Commission (CFTC) published its weekly Commitments of Traders (CoT) report for data ending Tuesday, July 21. For the first time since this data started being collected in June 2006, money managers reported a net short position in gold futures and options contracts. As shown in the chart below, money managers had long positions in 109,893 contracts and short positions in 121,238 contracts representing a net short position of 11,345 contracts.
The data from this past Friday's release revealed very similar results. The number of long positions decreased to 109,745 contracts and the number of short positions decreased to 121,079 contracts, leading to a net short position of 11,334 contracts. This marks the second consecutive week that money managers took a net short position in gold. The recent trend shown in the CoT report highlights the bearish outlook that many investors have taken on gold as of late.
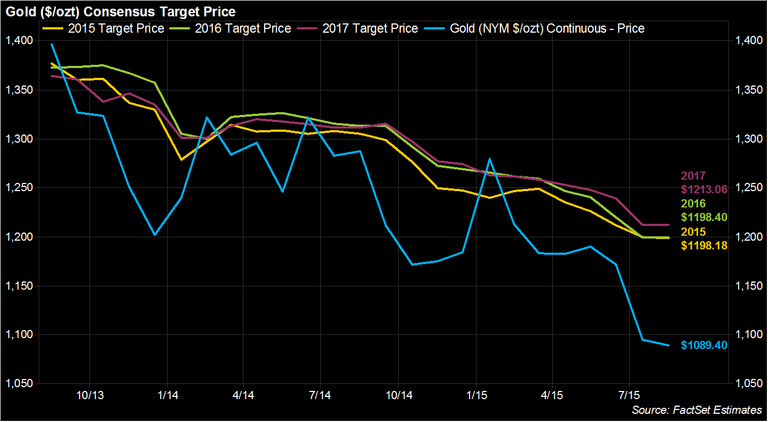
Given the bearish view of gold of money managers, what are analysts forecasting for gold prices in the upcoming quarters and years? According to FactSet Estimates, the consensus target price for gold as of the close on Monday stands at $1184.84 per troy ounce for the end of Q3 and $1198.18 per troy ounce for the end of the calendar year 2015. The consensus estimate represents a mean of the estimates submitted to FactSet by analysts. These target prices denote an upside of 8.76% and 9.98% based on Monday's closing price of the continuous gold futures contract ($1089.40).
Have analysts revised their estimates for gold since the July selloff? The answer is yes. Since the start of the quarter (July 1, 2015), analysts have cut their target prices on gold for Q3 and the full year. As of July 1, 2015, the consensus target price for Q3 was $1196.92, which is 1.01% higher than the current estimate ($1184.84). Additionally, the number of downward revisions by analysts increased from four to 10 over that same time period. For calendar year 2015, the consensus price target was $1211.71 at the start of the quarter, which is 1.12% higher than the current estimate ($1198.18). In terms of analyst revisions, the number of downward revisions actually decreased from 26 to 23 over that time period.
Looking at consensus target prices for gold for 2016 and 2017, a similar trend exists. Both of these target prices represent premiums to the price on gold's continuous futures contract. However, analysts have still been consistently cutting their forecasts for both years. As shown in the chart below, the 2016 and 2017 price targets for gold as of the close on Monday stand at $1198.40 and $1213.06, which denote a 10.01% and 11.35% upside to Monday's close price ($1089.40). These forecasts have been revised downward by 1.77% and 2.27% since the start of the quarter (July 1, 2015), once again highlighting the bearish sentiment towards gold.
Over the next few months, a number of factors may have contradictory impacts on the price of gold. On the negative side, there is the possibility of the announcement of an increase in interest rates by the Fed. While the announcement of a Fed rate hike has not had an immediate negative impact on the price of gold in recent years, there does appear to be a certain degree of negative correlation between rising interest rates and the price of gold. On the positive side, the price of gold historically has recorded its highest seasonal price increases during the month of September. It will be interesting to see which of these factors will be the driving force behind gold's next move.

Consumer Price Index (CPI) for June 2026 is Projected to Rise 3.8% Year-Over-Year
Explore FactSet's June 2025 CPI forecast, estimating a 3.8% rise. Get insights into inflation trends and economic impact for...
Total Nonfarm Payrolls for June 2026 Are Projected to Rise By 100,000
Stay updated with our monthly series analyzing nonfarm payroll data and job trends. Get expert insights and projections to...
Consumer Price Index (CPI) for May 2026 is Projected to Rise 4.2% Year-Over-Year
Explore FactSet's May 2026 CPI forecast, estimating a 4.2% increase. Get insights into inflation trends and economic impact for...
Total Nonfarm Payrolls for May 2026 Are Projected to Rise By 105,000
Stay updated with our monthly series analyzing nonfarm payroll data and job trends. Get expert insights and projections to...
The information contained in this article is not investment advice. FactSet does not endorse or recommend any investments and assumes no liability for any consequence relating directly or indirectly to any action or inaction taken based on the information contained in this article.

