

According to the The Forum for Sustainable and Responsible Investment, over 16% of money managed in the United States is done so in a socially responsible way. Further, from 2012 to 2014, there has been a 76% growth rate in the number of assets managed by socially responsible investing and a 36% increase in the number of Economic, Social, and Governance (ESG) mutual funds.
With the increased flow of funds into socially responsible investing, investors need better ways to understand and interpret their ESG exposures. In this article, we’ll review a method by which you can interpret ESG exposures within an attribution framework.
Related: Wealth Managers Take On the "Connected Generation"
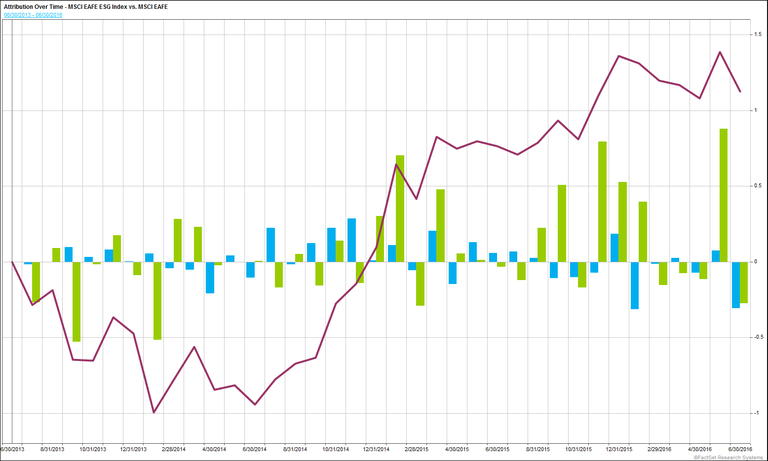
A performance attribution report can help to answer the question with a traditional allocation vs. selection breakdown. When we analyze the MSCI EAFE ESG Index against the MSCI EAFE for the past three years (ending 6/30/2016), we see that the ESG index outperformed by over 100 basis points.
Diving deeper, we can see that this effect was driven predominantly by security selection effect. One might think that the avoidance of certain sectors would be the chief source of outperformance, but in reality, the companies with higher ESG scores simply performed better than their broad counterparts.
Security selection added 91bps, while allocation only added 18bps during the three-year period analyzed.
Many investors are favoring ESG strategies for a variety of reasons, long-term performance being one of them. Assuming that your goal is to invest in ESG companies, you might ask:
MSCI rates issuers on three pillars: Environment, Social and Governance. The values range from 0-10 with higher scores ranking higher in the peer group.
We propose that these ESG scores can be decomposed in the same attribution framework for which we evaluate performance. This would allow us to split out our active ESG bets into ESG Allocation and ESG Selection effects.
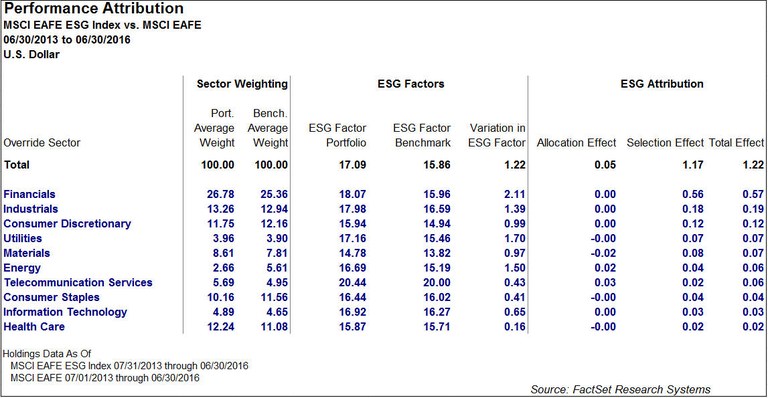
Continuing with our above example of the MSCI EAFE ESG vs. the MSCI EAFE, we can see that the ESG index had a score that was 122 basis points higher than the index. This is not surprising given the index objective.
In an ESG attribution framework, we then see that ESG security selection positively impacted our score across all 10 sectors. Looking at Energy in particular, the ESG Index underweighted Energy. This is a positive ESG allocation decision, as Energy has one of the lower ESG benchmark scores overall. The overall impact of ESG allocation is insignificant, only contributing five basis points to the ESG variance. As seen earlier, differences are almost entirely due to stock selection within this sector.
Related: Active Management and Understanding Analyst Forecasts
We propose that this analysis will be even more insightful when applied to investor portfolios that are taking many complicated, and often contradictory, bets. Without an understanding of the sources of active ESG bets that may exist in a portfolio, a portfolio manager may not be able to develop a repeatable strategy that adds value over time. Even for an investor that is not focused explicitly on ESG exposures, a framework such as this could be a valuable tool in understanding exposure to a factor that is clearly gaining popularity within the market.


Gold Mining Equity Analysis with the Custom Risk Module
Explore the process to build a bespoke risk model in this FactSet analysis, including data gathering, exposure outlier treatment...
Stress Testing Amid Rising Fears of an AI Bubble
Explore FactSet's stress testing strategies for risk managers amid AI bubble concerns, comparing current market sell-offs to the...
Stress Testing Investment Strategies: Combining Historical Data and Projected Assumptions (Podcast)
Explore portfolio stress testing to assess risk, including appropriate shock factors, historical scenarios and data, and your own...
Stress Test Your Portfolio Using 1990 and 2003 Middle East Conflict Scenarios
Explore how to leverage two FactSet hypothetical scenarios based on historical Middle East conflicts and stress test your...
The information contained in this article is not investment advice. FactSet does not endorse or recommend any investments and assumes no liability for any consequence relating directly or indirectly to any action or inaction taken based on the information contained in this article.

Insight/Author%20Bios/BadgeNLWF.svg)