Emily Kobyra, RMS Product Specialist, and Dan St. George, Implementation Specialist, contributed to this report.
Over the last few years, we’ve seen a significant downtick in the number of IPOs issued by companies, but will 2017 break that trend? So far this year we have seen five companies go public on a U.S. stock exchange, and today we saw the first tech IPO of the year with Snap, Inc.
Snap, Inc. is technology and social media company known for its mobile app Snapchat, which allows users to share photos and videos with friends for moments to hours before disappearing. Founded in July 2011, what began as a tech start-up garnered 23 active investors and raised around $2.6 billion in venture capital backing.
Now that Snap, Inc. has gone public with an IPO priced at $17 per share, ahead of the expected $14-$16 a share range, it’s trickier to forecast its performance. Looking at some of Snap’s numbers, investment attractiveness is likely to be in the eye of the beholder.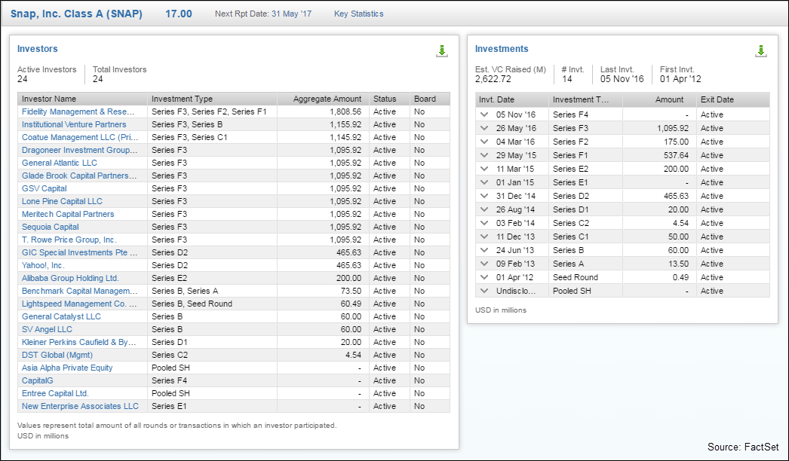
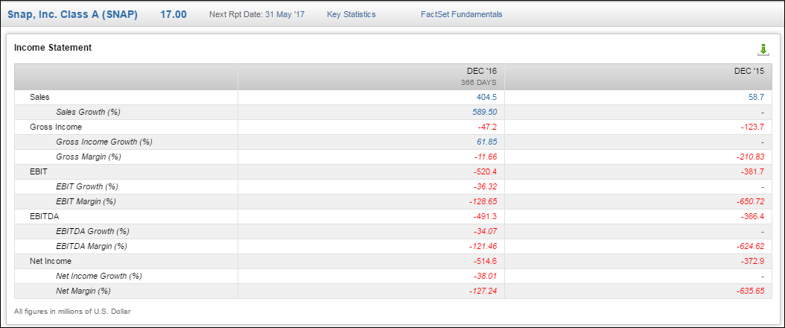
The company’s year-over-year sales growth as well as its EBIT growth are certainly noteworthy. Snap’s year-over-year sales growth is roughly 589% with $58.7 million in revenues in 2015 and $404.5 million in revenues in 2016. Additionally, it saw 36.32% decline in EBIT, which is significantly less than an aggregate of companies similar to it.
The biggest buzz since Snap’s initial IPO announcement was the large net losses of the company; surprising, since historically the company had seemed profitable to the public eye. With net losses of over $514 million, many investors are worried about Snap’s ability to become profitable over time. Additionally, year-over-year net income declined 38%. While this has probably influenced some potential shareholders, it seems like there is still a lot of optimism in the investing community around the Snap IPO and growth for the company in the future.
To give perspective on Snap’s recently reported financials, the S&P 500 Technology Sector as a whole saw a 2.26% decline in the 12 months ending in December 2016. Perhaps more significantly, Snap’s fellow social media competitors Twitter (TWTR) and Facebook (FB) saw 18.4% and 98.4% growth in EBIT respectively.

Comparing Snap to Previous IPOs
Compared to its peers in the tech industry, Snap’s sales growth gets solid marks, but its EBIT growth could conceivably raise concerns. Is this something interested investors can bank on for post-IPO performance? We can look back at Twitter and Facebook the year leading up to their IPOs to understand the performance of post-IPO tech companies.
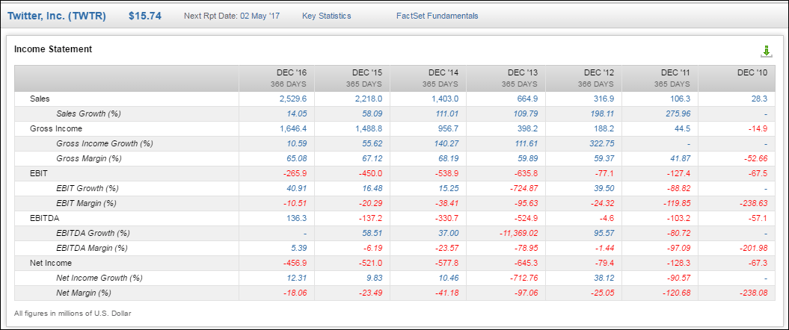
Looking first at Twitter, which had its initial public offering in November 2013, sales growth was also very strong, but EBIT and net income growth were lacking, as with Snap. Since then, sales growth has decreased from over 109% year-over-year to roughly 14% year-over-year in 2016. While EBIT growth increased from -724% in 2013 to over 18% in 2016, the company appears to have struggled to keep that number positive. There is a similar trend with net income growth over time as well. These metrics are very similar to Snap’s pre-IPO numbers.
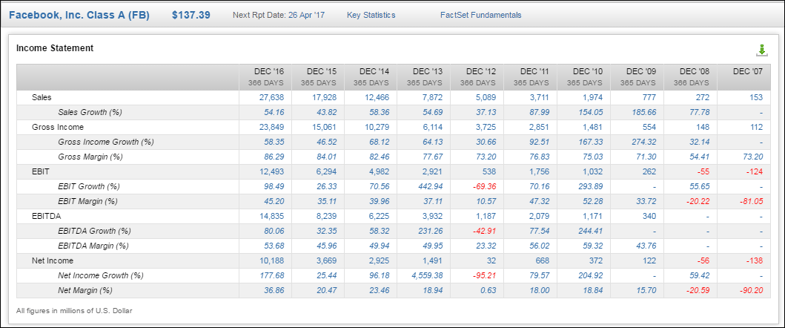
Facebook, another key competitor of Snap, has a slightly different story than Twitter. While Facebook also had strong sales growth and negative EBIT and net income growth prior to its IPO in 2013, it has consistently grown year-over-year since then to become currently profitable. Sales have consistently grown almost 50% year-over-year since 2013. Additionally, Facebook was able to turn around negative EBIT growth prior to its IPO in 2012 by increasing EBIT by over 442% in 2013. Since its IPO, Facebook has had positive net income, increasing in 2016 by an astounding 177%.
Ahead of its IPO, SNAP has significantly more capital at its disposal than any of its peers at the same time, with 24 investors and $14.29 billion.
| Company |
aggregate investor amount (millions) |
| Snap, Inc. |
$14,287.56 |
| Twitter, Inc. |
$4,479.61 |
| Facebook, Inc. |
$2,513.40 |
| Fitbit, Inc. |
$321.24 |
As we’ve seen, an estimated $2.62 billion of that capital was raised from venture capital, while Facebook ($1.54) and Twitter ($1.55) both had more than a billion dollars less prior to their IPO. Snap has clearly been able to raise more funds, which could translate into immediate performance, unlike with Twitter and Facebook, which performed poorly early on.
Looking at the IPOs of Facebook, Twitter, and wearable technology company Fitbit, Inc., on an absolute basis, we see an overall price decline over the six months following their IPOs. When comparing the companies to the market, only Fitbit, Inc. outperformed, and that was after suffering initial declines in its first few weeks.
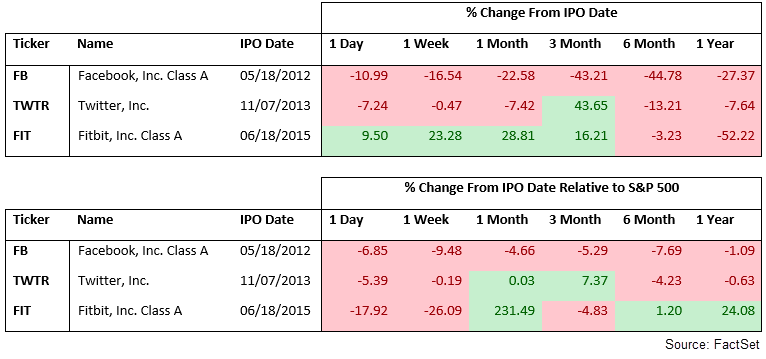
We don’t know what the Snap IPO could lead to down the line. However, with financials that line up closely with peers Twitter and Facebook, two divergent paths seem possible. Will Snap follow in the footsteps of these competitors, or will it start a new trend altogether in the tech industry? With an IPO said to be the biggest since Alibaba (BABA) in 2014, it will be interesting to see if the company can live up to the hype.
