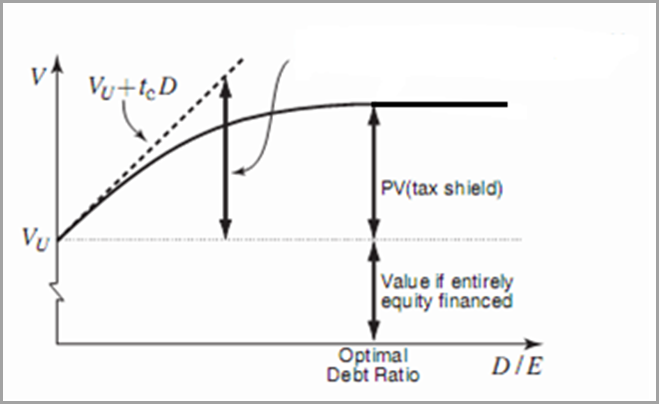
If an unlevered firm with a VU = $100 mil chooses to issue debt of D = $25 mil, it will economize on its tax burden by a $6.25 mil if the corporate tax rate for the firm is tC = 25%. The levered firm value, VL , will increase by the amount of tax shield that comes from using debt by tCD = 25% x 25 =$ 6.25 mil from VU=$75 mil to VL=$81.25 mil.
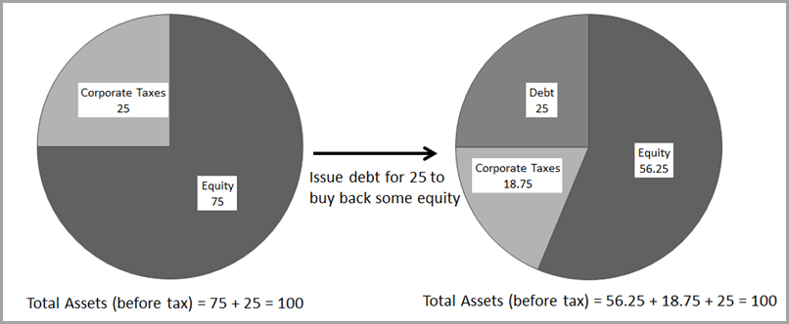
Shareholders are better off in this second situation, therefore the corporation should increase its debt/equity ratio. In effect, this will increase the after-tax value of the firm’s assets by an amount equal to the tax shield associated with the debt interest deductions. The value of the levered firm is: VL = VU + tCD
This implies that if the relationship were linear, the optimal capital structure would be 100% debt. In practice, VL flattens out because the value of incremental interest deductions falls as more interest is used.
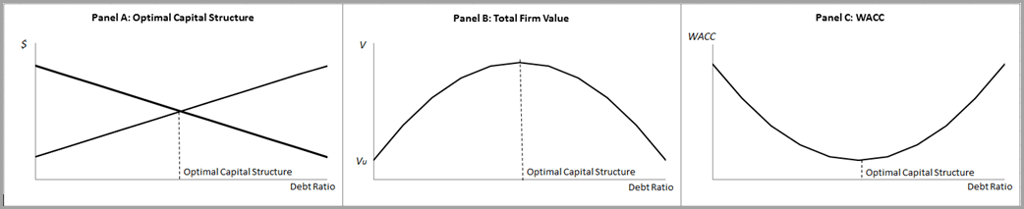
In the figure below, Panel A illustrates that a manager facing these cost and benefit curves would choose a debt level where the two curves intersect:
Panel B shows that firm value without any debt is at Vu. If the firm adds debt to its capital structure, the value begins to rise and eventually reaches a peak. After the peak point, firm value decreases as more debt is added.
Managers want to find the debt ratio that minimizes the (weighted average) cost of capital, WACC, as it maximizes the firm value. The optimum point in Panel C is the same optimum debt ratio as in Panels A and B.
Besides reducing the incremental value of the interest tax shield, leverage also increases the probability of bankruptcy. However, bankruptcy in and of itself is not costly if the value of the firm is efficiently transferred to the bondholders. There are numerous inefficiencies that can result from financial distress:
| Direct costs | Indirect costs |
|
|
|
|
|
|
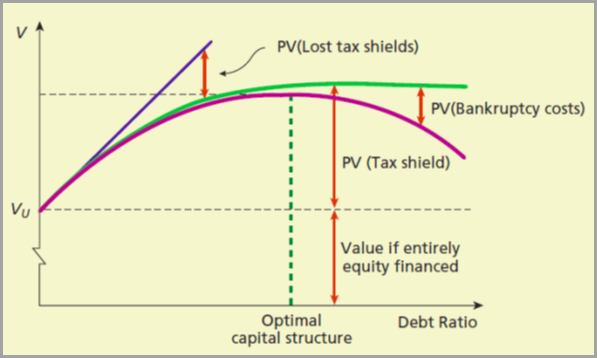
The value of the levered-firm is then: VL = VU + PVtax shields - PVbankruptcy costs
The following figure shows how the trade-off between tax benefits and the cost of distress affect the optimal capital structure:
Studies on Capital Structure provide ample evidence that:
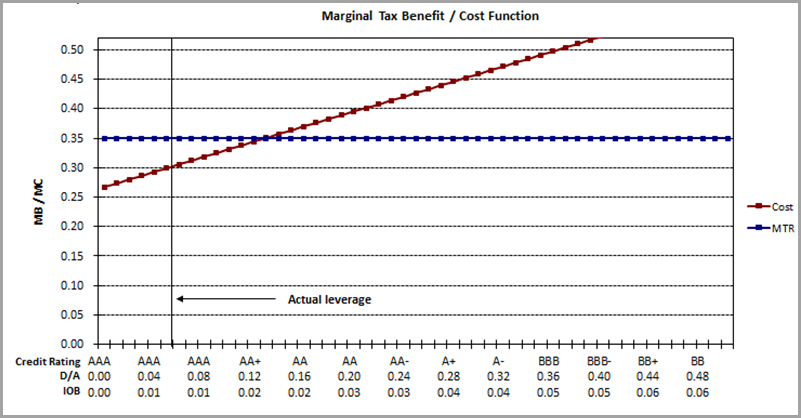
For example, Graham1 estimates a tax benefit function (marginal benefit curve, MB) by simulating the marginal tax benefit given a firm’s interest deductions2. Then follows on to estimate marginal cost, MC curve as:

A slope of 4.81 means that for every extra dollar of interest, the cost of debt increases by about a nickel. The intersection of MB and MC curves is the optimal interest expense over book assets (debt intensity) and optimal level of leverage.
Using data from the FactSet Fundamentals dataset we plot the MC (red) and MB (blue) curves for Exxon Mobil Corporation.
From the figure above, we can determine that the company is under-levered (5% actual leverage). However, Exxon would actually benefit from increasing its leverage to the optimal level (12.9%). The table below shows that the net tax benefit of debt is 0.8% actual and 1.2% at optimal. The difference, 0.4% (of assets), is the value loss due to not being optimal.
| Ratio | Actual | Optimal |
| Interest Expense/Book Value (IOB) | 0.7% | 1.8% |
| Leverage (Debt/Assets) | 5.0% | 12.9% |
| Net tax benefit of debt/assets | 0.8% | 1.2% |
| Value loss due to not being optimal (% of assets) | 0.4% | |
| Credit Rating | AAA | AA+ |
The last row of the table uses the findings of Molina3. This shows what the company’s credit rating would be if it was operating at its optimal leverage ratio rather than actual. In this example, since the optimal leverage ratio is higher, it would yield to a lower credit rating. However, the tax benefit of the added debt more than offsets the increase in the WACC, as seen in the increase in the net tax benefit of debt.
Increasing (decreasing) a firm’s leverage may imply a lower (higher) credit rating, which would yield to a higher (lower) WACC. However, if the net tax benefit of debt is still positive after accounting for changes in the WACC, firms should adjust leverage. The bottom line is that a company would add shareholder value by operating at its optimal level of leverage.
1Graham, John R., 2000. “How big are the tax benefits of debt?” Journal of Finance 55, 1901–1941.
2As explained in the previous risk blog article “Underleverage: A Corporate Finance Puzzle and an Alternative Explanation”, July 2013.
3Molina, C. A. (2005). “Are Firms Underleveraged? An Examination of the Effect of Leverage on Default Probabilities.” Journal of Finance 3: 1427-1459.


Stress Testing Amid Rising Fears of an AI Bubble
Explore FactSet's stress testing strategies for risk managers amid AI bubble concerns, comparing current market sell-offs to the...
Stress Testing Investment Strategies: Combining Historical Data and Projected Assumptions (Podcast)
Explore portfolio stress testing to assess risk, including appropriate shock factors, historical scenarios and data, and your own...
Stress Test Your Portfolio Using 1990 and 2003 Middle East Conflict Scenarios
Explore how to leverage two FactSet hypothetical scenarios based on historical Middle East conflicts and stress test your...
Geopolitical Risk Scenarios: Stress Testing Investment Strategies Amid the War in Iran
Stay ahead of evolving markets with a stress testing module from FactSet. Use it as your starting point and build in your...
The information contained in this article is not investment advice. FactSet does not endorse or recommend any investments and assumes no liability for any consequence relating directly or indirectly to any action or inaction taken based on the information contained in this article.