There are a multitude of events that can affect fixed income manager and portfolio performance, many of which relate to low default rates and corporate earnings, tight spread levels, and a flattening yield curve with short-term rates rising. In today's environment, employing multiple flavors of attribution, or (more importantly) employing an attribution model that aligns with a portfolio manager’s investment process can help explain how the endless barrage of market, economic, and political themes play a role in relative performance. Whether including additional attribution effects or grouping a portfolio by earnings growth, managers can uncover the key themes in fixed income and how they have affected performance while understanding the effectiveness of a specific investment manager or strategy.
Attribution in Action
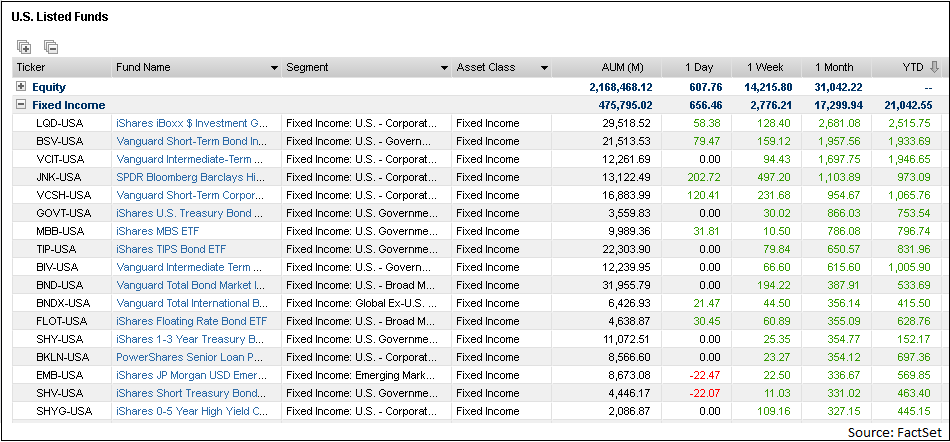
Analyzing the year-to-date fixed income ETF fund flows as a proxy to investors’ appetite shows us that short term and floating rate funds have been a popular investment vehicle.

Short-term funds and portfolios may not be the most enticing asset class, and explaining attribution for them is pretty cookie cutter, but, really, should it be? With short-term rates rising, spreads at their tightest levels in quite some time, and strong corporate earnings, explaining performance may benefit from a more tailored approach.

By analyzing an attribution report like the one above, we see that the short-term portfolio employed a short duration position in a rising rate environment, which helped contribute 79 bps to outperformance (70 bps from shift and 9 from twist). The manager’s overweight to Government Agency added an additional 7 bps. However, selection detracted 47 bps, mostly driven by security selection in financials. Is that 47 bps explained through security selection, or is there more going on here?
In this case, the portfolio’s spread management decisions and lower income generation hampered its performance. Unsurprisingly, the biggest detractor was within the financial sector.
By then analyzing the financial sector, we can determine that the portfolio was slightly underweight vs. the benchmark.

We can also see the portfolio started the period with tighter spread levels (91 for the portfolio vs. 100.29 for the benchmark). In a spread tightening cycle, this leaves the manager less room for additional upside, especially with a lower spread duration. In this case, the benchmark tightened by 13 bps vs. 8 bps for the portfolio, which with less sensitivity to tightening spreads (portfolio spread duration of 2.07 vs. benchmark of 2.71) created a performance drag.

This information combined with a lower average coupon rate (2.8% vs. 3.4%), explains why the portfolio lost additional bps in return.
In addition to catering the attribution model to expose hidden performance, adjusting the grouping used in the report will also uncover how the portfolio’s exposure to floating rate securities contributed to performance. In a period of raising rates, it typically pays off to own floating rate debt, especially if the Federal Reserve accelerates the timing of rate hikes. Leveraging the same portfolio, the fund was overweight floating rate debt, which proved to be a beneficial portfolio management decision across the board.

As we’ve seen, leveraging a flexible attribution model lets portfolio managers, sales teams, performance analysts, and investors see which hidden market factors impeded the portfolio from performing to its full potential.
