

In the previous installment of this series we evaluated the efficacy of our signal, using FactSet’s Alpha Testing platform to back-test our results. Following that we constructed portfolios using the mean-variance optimization framework described in Markowitz’s bookPortfolio Selection: Efficient Diversification of Investment. In this segment of our series we’ll discuss the efforts that go into measuring the performance of the various portfolios we’ve created and evaluate the strengths and failings of each.
Starting with the base case portfolio gross return (dotted red line); at first glance the portfolio we constructed in part two appears to do quite well, with 191.79% outperformance over 10 years. The results aren’t as strong as the Q1 factor portfolio, but they still look promising. After accounting for transaction costs (solid red line), however, excess returns drop significantly to just 28.69% over 10 years, leaving us with lackluster results and virtually eliminating Alpha.
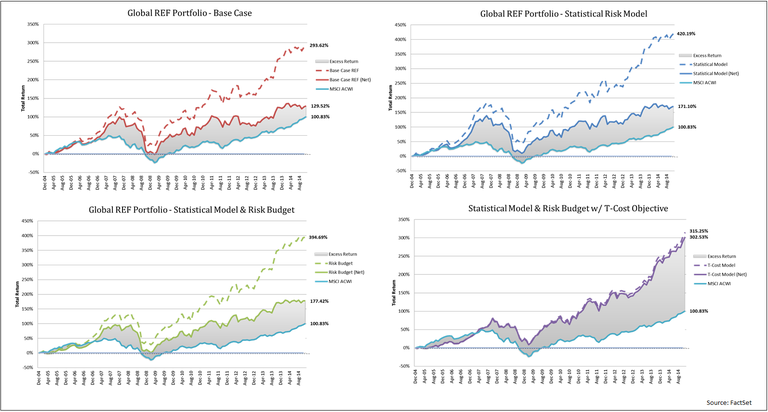
Employing a statistical risk model (blue line) yields a much higher gross return. The new model does a better job at efficiently transferring alpha into the portfolio. Once again, however, transaction costs significantly diminish our net return leaving us with 70.27% of excess return.
Combining the statistical risk model with a risk budget constraint (green line) actually slightly lowers our gross return. This makes intuitive sense because by constraining the portfolio further we are lowering the theoretical best bound for our utility function. Although we have less exposure to our alpha signal, volatility drops in this portfolio as compared to the previous one. Despite gross returns being lower, net returns have improved putting us at 76.59% excess return.
Related: Quantitative Easing and Macroeconomic Volatility
Our final portfolio (purple line) combines previous changes with a more sophisticated objective term that seeks to minimize transaction costs while maximizing expected returns. Not surprisingly, this portfolio has a sharp drop in Alpha exposure which results in much lower gross returns. Similar to the risk budget, this makes intuitive sense because we’re transferring less Alpha into the portfolio due to our new utility function. When we account for transaction costs, the difference is minimal, and our net return is in fact significantly stronger than any of the prior portfolios. We have gone from a total net excess return of 28.69% up to 201.7%, which is not far behind from our Q1 factor portfolio. The following table summarizes the results across all of our portfolios.
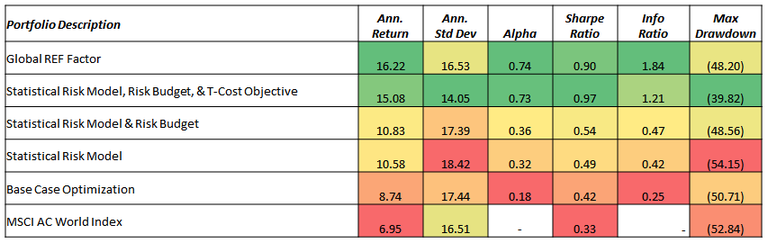
Our results show that the base case portfolio outperforms the benchmark marginally. Although annualized returns are above the benchmark, annualized volatility is also higher which results in relatively poor Sharpe and Information Ratios. The incorporation of a statistical risk model materially improves returns but also increases volatility. The increase in volatility is outweighed by the jump in returns as shown by improved Alpha, Sharpe, and information ratios. While the risk budget constraint only incrementally improves performance, volatility is decreased even below our base case which continues to improve risk/reward ratios as well as lowering drawdowns.
We’ve shown here that risk budgeting did a better job of controlling volatility than capping asset weight alone. Lastly, incorporating the transaction cost variable into our objective function spiked net returns drastically as excess returns were no longer being consumed by broker fees. The final portfolio produces materially higher returns with lower volatility and brings our Alpha and Information Ratio close to the Q1 Factor portfolio, while the Sharpe Ratio and Drawdown are even better.
To conclude, we have shown how our stock selection framework performs unconstrained and taken steps to create an investable portfolio which performs nearly as well. The natural next question is whether or not we can exceed the pure factor performance by taking advantage of variables exogenous to the stock selection model.
Read part one of this series: Moving from Research to Construction: Stock Selection
Read part two of this series: Moving from Research to Construction: Evaluating Performance
Insight/Author%20Bios/Bijan%20Beheshti%20Insight.jpg)
Mr. Bijan Beheshti is Senior Vice President, Global Director of Analytics and Trading Sales at FactSet. In this role, he oversees strategic initiatives and facilitates growth across the Analytics and Trading business. Prior to his current role, Mr. Beheshti served as Director of Global Quantitative Analytics. He joined FactSet in 2010 and spent the last twelve years working across multiple business functions within the organization. His research has been published in the Journal of Portfolio Management, Journal of Investing, International Journal of Forecasting, and Frontiers in Applied Mathematics and Statistics. Mr. Beheshti earned his bachelor’s degree in economics from the University of California, Los Angeles and is a CFA charterholder, Certified Public Accountant, and Certified FRM.

Stress Testing Amid Rising Fears of an AI Bubble
Explore FactSet's stress testing strategies for risk managers amid AI bubble concerns, comparing current market sell-offs to the...
Stress Testing Investment Strategies: Combining Historical Data and Projected Assumptions (Podcast)
Explore portfolio stress testing to assess risk, including appropriate shock factors, historical scenarios and data, and your own...
Stress Test Your Portfolio Using 1990 and 2003 Middle East Conflict Scenarios
Explore how to leverage two FactSet hypothetical scenarios based on historical Middle East conflicts and stress test your...
Geopolitical Risk Scenarios: Stress Testing Investment Strategies Amid the War in Iran
Stay ahead of evolving markets with a stress testing module from FactSet. Use it as your starting point and build in your...
The information contained in this article is not investment advice. FactSet does not endorse or recommend any investments and assumes no liability for any consequence relating directly or indirectly to any action or inaction taken based on the information contained in this article.
